Bayesian Analysis vs Actuarial Methods21/4/2021
David Mackay includes an interesting Bayesian exercise in one of his books [1]. It’s introduced as a situation where a Bayesian approach is much easier and more natural than equivalent frequentist methods. After mulling it over for a while, I thought it was interesting that Mackay only gives a passing reference to what I would consider the obvious ‘actuarial’ approach to this problem, which doesn’t really fit into either category – curve fitting via maximum likelihood estimation.
On reflection, I think the Bayesian method is still superior to the actuarial method, but it’s interesting that we can still get a decent answer out of the curve fitting approach. The book is available free online (link at the end of the post), so I’m just going to paste the full text of the question below rather than rehashing Mackay’s writing: The St Petersburg Paradox21/8/2020
Let me introduce a game – I keep flipping a coin and you have to guess whether it will come up heads or tails. The prize pot starts at \$2, and each time you guess correctly the prize pot doubles, we keep playing until you eventually guess incorrectly at which point you get whatever has accumulated in the prize pot.
So if you guess wrong on the first flip, you just get the \$2. If you guess wrong on the second flip you get \$4, and if you get it wrong on the 10th flip you get \$1024. Knowing this, how much would you pay to enter this game? You're guaranteed to win at least \$2, so you'd obviously pay at least $\2. There is a 50% chance you'll win \$4, a 25% chance you'll win \$8, a 12.5% chance you'll win \$16, and so on. Knowing this maybe you'd pay \$5 to play - you'll probably lose money but there's a decent chance you'll make quite a bit more than \$5. Perhaps you take a more mathematical approach than this. You might reason as follows – ‘I’m a rational person therefore as any good rational person should, I will calculate the expected value of playing the game, this is the maximum I should be willing to play the game’. This however is the crux of the problem and the source of the paradox, most people do not really value the game that highly – when asked they’d pay somewhere between \$2-\$10 to play it, and yet the expected value of the game is infinite.... 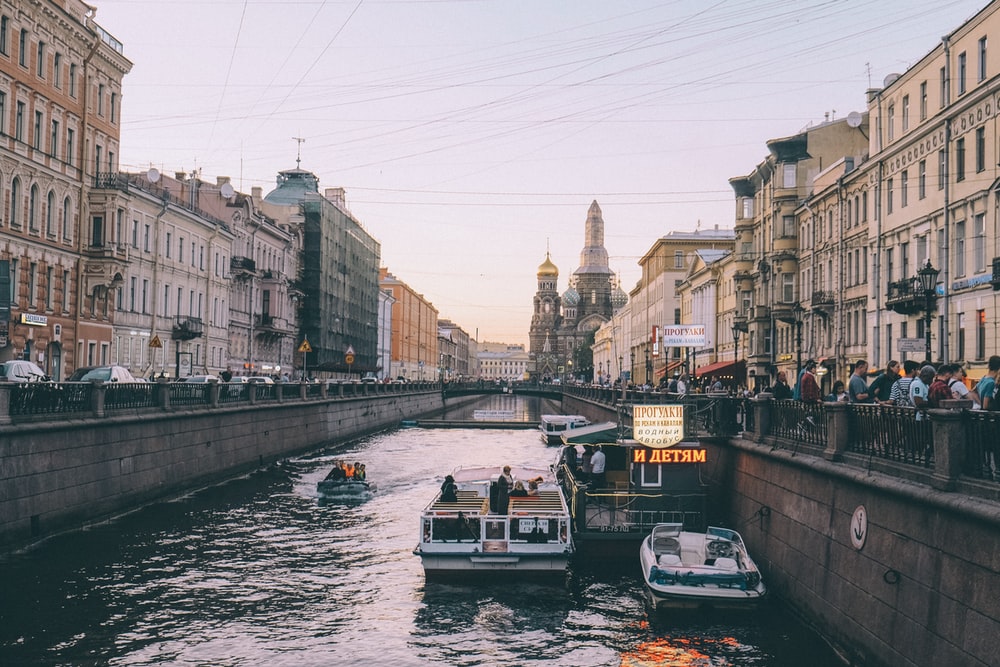
Source: https://unsplash.com/@pujalin
The above is a lovely photo I found of St Petersburg. The reason the paradox is named after St Petersburg actually has nothing to do with the game itself, but is due to an early article published by Daniel Bernoulli in a St Petersburg journal. As an aside, having just finished the book A Gentleman in Moscow by Amor Towles (which I loved and would thoroughly recommend) I'm curious to visit Moscow and St Petersburg one day.
Excel Protect Sheet Encryption27/12/2019
The original idea for this post came from a slight quirk I noticed in some VBA code I was running (code pasted below) If you've ever needed to remove the protect sheet from a Spreadsheet without knowing the password, then you probably recognise it.
Sub RemovePassword()

Dim i As Integer, j As Integer, k As Integer
Dim l As Integer, m As Integer, n As Integer
Dim i1 As Integer, i2 As Integer, i3 As Integer
Dim i4 As Integer, i5 As Integer, i6 As Integer
On Error Resume Next
For i = 65 To 66: For j = 65 To 66: For k = 65 To 66
For l = 65 To 66: For m = 65 To 66: For i1 = 65 To 66
For i2 = 65 To 66: For i3 = 65 To 66: For i4 = 65 To 66
For i5 = 65 To 66: For i6 = 65 To 66: For n = 32 To 126
ActiveSheet.Unprotect Chr(i) & Chr(j) & Chr(k) & _
Chr(l) & Chr(m) & Chr(i1) & Chr(i2) & Chr(i3) & _
Chr(i4) & Chr(i5) & Chr(i6) & Chr(n)
If ActiveSheet.ProtectContents = False Then
MsgBox "Password is " & Chr(i) & Chr(j) & _
Chr(k) & Chr(l) & Chr(m) & Chr(i1) & Chr(i2) & _
Chr(i3) & Chr(i4) & Chr(i5) & Chr(i6) & Chr(n)
Exit Sub
End If
Next: Next: Next: Next: Next: Next
Next: Next: Next: Next: Next: Next
End Sub
Nothing too interesting so far, the code looks quite straight forward - we've got a big set of nested loops which appear to test all possible passwords, and will eventually brute force the password - if you've ever tried it you'll know it works pretty well. The interesting part is not so much the code itself, as the answer the code gives - the password which unlocks the sheet is normally something like ‘AAABAABA@1’. I’ve used this code quite a few times over the years, and always with similar results, the password always looks like some variation of this string. This got me thinking - surely it is unlikely that all the Spreadsheets I’ve been unlocking have had passwords of this form? So what’s going on? After a bit of research, it turns out Excel doesn’t actually store the original password, instead it stores a 4-digit hash of the password. Then to unlock the Spreadsheet, Excel hashes the password attempt and compares it to the stored hashed password. Since the size of all possible passwords is huge (full calculations below), and the size of all possible hashes is much smaller, we end up with a high probability of collisions between password attempts, meaning multiple passwords can open a given Spreadsheet. I think the main reason Microsoft uses a hash function in this way rather than just storing the unhashed password is that the hash is stored by Excel as an unencrypted string within a xml file. In fact, an .xlsx file is basically just a zip containing a number of xml files. If Excel didn't first hash the password then you could simply unzip Excel file, find the relevant xml file and read the password from any text editor. With the encryption Excel selected, the best you can do is open the xml file and read the hash of the password, which does not help with getting back to the password due to the nature of the hash function. What hash function is used? I couldn't find the name of the hash anywhere, but the following website has the fullest description I could find of the actual algorithm. As an aside, I miss the days when the internet was made up of websites like this – weird, individually curated, static HTML, obviously written by someone with deep expertise, no ads as well! Here’s the link: http://chicago.sourceforge.net/devel/docs/excel/encrypt.html And the process is as follows:
Here is the algorithm to create the hash value:
a -> 0x61 << 1 == 0x00C2 b -> 0x62 << 2 == 0x0188 c -> 0x63 << 3 == 0x0318 d -> 0x64 << 4 == 0x0640 e -> 0x65 << 5 == 0x0CA0 f -> 0x66 << 6 == 0x1980 g -> 0x67 << 7 == 0x3380 h -> 0x68 << 8 == 0x6800 i -> 0x69 << 9 == 0x5201 (unrotated: 0xD200) j -> 0x6A << 10 == 0x2803 (unrotated: 0x1A800) count: 0x000A constant: 0xCE4B result: 0xFEF1 This value occurs in the PASSWORD record.
How many trials will we need to decrypt?
Now we know how the algorithm works, can we come up with a probabilistic bound on the number of trials we would need to check in order to be almost certain to get a collision when carrying out a brute force attack (as per the VBA code above)?
This is a fairly straight forward calculation – the probability of guessing incorrectly for a random attempt is $\frac{1}{65536}$. To keep the maths simple, if we assume independence of attempts, the probability of not getting the password after $n$ attempts is simply: $$ \left( \frac{1}{65536} \right)^n$$ The following table then displays these probabilities
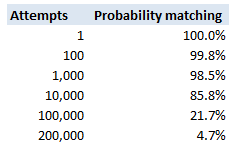
So we see that with 200,000 trials, there is a less than 5% chance of not having found a match.
We can also derive the answer directly, we are interested in the following probabilistic inequality: $$ \left( 1- \frac{1}{65536} \right)^k < 0.05$$ Taking logs of both sides gives us: $$ln \left( 1- \frac{1}{65536}\right)^k = ln( 0.05)$$ And then bringing down the k: $$k * ln \left( 1- \frac{1}{65536} \right) = ln(0.05)$$ And then solving for $k$: $$k = \frac{ ln(0.05)}{ln \left(1- \frac{1}{65536}\right)} = 196,327$$
Can I work backwards to find the password from a given hash?
As we explained above, in order to decrypt the sheet, you don’t need to find the password, you only need to find a password. Let’s suppose however, for some reason we particularly wanted to find the password which was used, is there any other method to work backwards? I can only think of two basic approaches: Option 1 – find an inversion of the hashing algorithm. Since this algorithm has been around for decades, and is designed to be difficult to reverse, and so far has not been broken, this is a bit of a non-starter. Let me know if you manage it though! Option 2 – Brute force it. This is basically your only chance, but let’s run some maths on how difficult this problem is. There are $94$ possible characters (A-Z, a-z,0-9), and in Excel 2010, the maximum password length is $255$, so in all there are, $94^{255}$ possible passwords. Unfortunately for us, that is more than the total number of atoms in the universe $(10^{78})$. If we could check $1000$ passwords per second, then it would take far longer than the current age of the universe to find the correct one. Okay, so that’s not going to work, but can we make the process more efficient? Let’s restrict ourselves to looking at passwords of a known length. Suppose we know the password is only a single character, in that case we simply need to check $94$ possible passwords, one of which should unlock the sheet, hence giving us our password. In order to extend this reasoning to passwords of arbitrary but known length, let’s think of the hashing algorithm as a function and consider its domain and range: Let’s call our hashing algorithm $F$, the set of all passwords of length $i$, $A_i$, and the set of all possible password hashes $B$. Then we have a function: $$ F: A_i -> B$$ Now if we assume the algorithm is approximately equally spread over all the possible values of $B$, then we can use the size of $B$ to calculate the size of the kernel $F^{-1}[A_i]$. The size of $B$ doesn’t change. Since we have a $4$ digit hexadecimal, it is of size $16^4$, and since we know the size of $A_i$ is $96$, we can then estimate the size of the kernel. Let’s take $i=4$, and work it through:
$A_4$ is size $96^4 = 85m$, $B = 65536$, hence $|F^{-1}[A_4]| = \frac{85m}{65536} = 124416$
Which means for every hash, there are $124,416$ possible $4$ digit passwords which can create this hash, and therefore may have been the original password. Here is a table of the values for $I = 1$ to $6$: 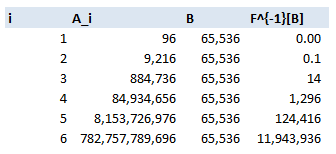
In fact we can come up with a formula for size of the kernel: $$\frac{96^i}{16^4} \sim 13.5 * 96^{i-2}$$
Which we can see quickly approaches infinity as $i$ increases. So for $i$ above $5$, the problem is basically intractable without further improvement. How would we progress if we had to? The only other idea I can come up with is to generate a huge array of all possible passwords (based on brute forcing like above and recording all matches), and then start searching within this array for keywords. We could possibly use some sort of fuzzylookup against a dictionary of keywords. If the original password did not contain any words, but was instead just a fairly random collection of characters then we really would be stumped. I imagine that this problem is basically impossible (and could probably be proved to be so using information theory and entropy) Who invented this algorithm? No idea…I thought it might be fun to do a little bit of online detective work. You see this code all over the internet, but can we find the original source? This site has quite an informative page on the algorithm: https://www.spreadsheet1.com/sheet-protection.html The author of the above page is good enough to credit his source, which is the following stack exchange page: https://superuser.com/questions/45868/recover-sheet-protection-password-in-excel Which in turns states that the code was ‘'Author unknown but submitted by brettdj of www.experts-exchange.com’ I had a quick look on Experts-exchange, but that's as far as I could get, at least we found the guy's username. Can we speed the algorithm up or improve it in any way? I think the current VBA code is basically as quick as it is going to get - the hashing algorithm should work just as fast with a short input as a 12 character input, so starting with a smaller value in the loop doesn’t really get us anything. The only real improvement I can suggest, is that if the Spreadsheet is running too slowly to be able to test a sufficient number of hashes per second, then the hashing algorithm could be implemented in python (which I started to do just out of interest, but it was a bit too fiddly to be fun). Once the algorithm is set up, the password could then be brute forced from there (in much quicker time), and one a valid password has been found, this can then be simply typed into Excel. Gaming my office's Cheltenham Sweepstake31/3/2019 Every year we have an office sweepstake for the Cheltenham horse racing festival. Like most sweepstakes, this one attempts to remove the skill, allowing everyone to take part without necessarily needing to know much about horse racing. In case you’re not familiar with a Sweepstake, here’s a simple example of how one based on the World Cup might work:
Note that in order for this to work properly, you need to ensure that the team draw is not carried out until everyone who wants to play has put their money in – otherwise you introduce some optionality and people can then decide whether to enter based on the teams that are still left. i.e. if you know that Germany and Spain have already been picked then there is less value in entering the competition. The rules for our Cheltenham sweepstake were as follows: The Rules The festival comprises 7 races a day for 4 days, for a total of 28 races. The sweepstake costs £20 to enter, and the winnings are calculated as follows: 3rd place in competition = 10% of pot 2nd place in competition = 20% of pot 1st place in competition = 70% of pot Each participant picks one horse per race each morning. Points are then calculated using the following scoring system:
A running total is kept throughout the competition, and the winner is determined after the final race. The odds the scoring are based on are set using the odds printed in the Metro Newspaper on the morning of the races. (as an example, for a horse which has odds of 11/2 in the Metro - if the horse then places 1st, if we selected this horse, we would win (1+11/2)*5 = 32.5 points) Initial thoughts Any set of betting odds can be converted to an implied probability of winning, these would be the odds which over the long run would cause you to breakeven if the race were repeated multiple times with each horse winning a proportion equal to its probability of winning. Because the scoring in our sweepstake is based on the betting odds, using implied probabilities derived from the odds to help select our horses ends up cancelling itself out (which was the intention when designing the rules). The implied probability can be calculated as one over the odds As an aside, the bookie is indifferent to whether this is the correct probability of winning, they structures the odds purely on the ratio of how their customers are betting. They then structure the odds so that they make money on each race, regardless of which horse wins, for an explanation of this, see my post on creating a Dutchbook: www.lewiswalsh.net/blog/archives/12-2017 Here is an example showing how we would calculate the implied probabilities using some made up odds: 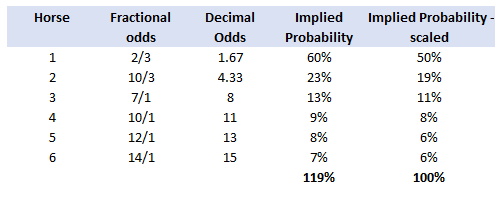 We can then use the implied probabilities we just calculated to see what would happen if each horse finished in the first three positions. Once we have done this, we can then calculate the Expected Value of betting on each horse: 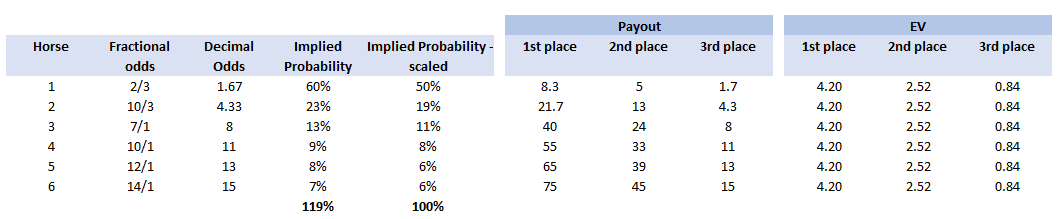 We see that the payout varies for each horse, but the EV is the same. This is by design, the intention is that it should not matter which horse you bet on, the sweepstake rules equalise everyone. So what can we - an actuary who knows nothing much about horse racing - do? I don’t have any special knowledge that would allow me to select a horse which would beat the odds listed in the Metro, we appear to be at an impasse. I could attempt to build a model of which horse will win, and then select my horse based on that, but unless it proves to be more accurate than the Metro odds, I might as well just pick at random. Furthermore, if I could build such a model, then I could just start betting actual money. This probably shows you what a difficult problem this is! There's no such thing as free money. It would be a cool project to try, and it’s something I’ve been meaning to attempt for a while, but that’s best saved for another day. Attempt 1 - Metro vs pre-race odds My first thought was that we can exploit the difference in odds between those published in the Metro in the morning, and the latest odds published closer to the start of the race. It seems reasonable to assume that the odds just before the race should be more accurate than the metro odds. There will have been time for additional information to be included in the more up to date odds, e.g. the weather is worse than expected therefore horse x is expected to be slower than usual. Since the payout will be based on the Metro, we will then be able to maximise our EV by exploiting this differential. Our table will end up looking something like this: 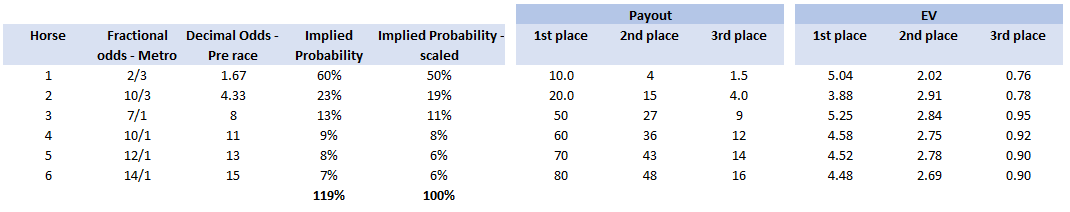 We see that we have very small variations in the EVs for some of the horses. It looks like according to this analysis Horse 3 would be the best selection as it has the highest EVs for 1st, 2nd, and 3rd. Based on this strategy, we would then go through each race and select the horse with the highest EV. Is this what I did? No, for a couple of reasons. The biggest issue was that the Metro did not publish odds in the morning for all races, meaning we couldn’t use the Metro, and therefore the rules of the sweepstake were amended to use the official pre-race odds to calculate the payout instead. This meant there was only one set of odds used, and our edge disappeared! Even if we had used this method, there was a more fundamental issue - the margins we ended up with were tiny anyway. The Metro vs pre-race odds did not swing wildly, meaning that even selecting the horse with the highest EV were only marginally better than picking at random. So, was there an alternative? Attempt 2 - 2nd and 3rd place odds My next attempt at an exploitative strategy was based on the insight that the payout multiplier for 2nd and 3rd place was based on the odds of the horse coming 1st, rather than the odds of the horse coming 2nd or 3rd. The expected value of a horse was not quite as I calculated above, it was actually: $$EV = P(1)*p_1 + P(2)*p_2 + P(3)*p_3$$ Above, we were using the implied probability of the horse coming first as a proxy for the probability it would come second and third. This is not the same, and some betting websites do allow you to bet on whether a horse will come 2nd or 3rd. For websites that do not allow you to bet directly on this, then we may still be able to calculate it from the odds for whether a horse finishes in the top 2 or 3 places. We just need to subtract out the implied probability of coming 1st from the probability of coming in the top 2, and then subtracting this out from coming top 3 etc. I therefore added some more columns to my table above, corresponding to the probability of the horses coming 2nd and 3rd, and then used this to calculate the EV instead. 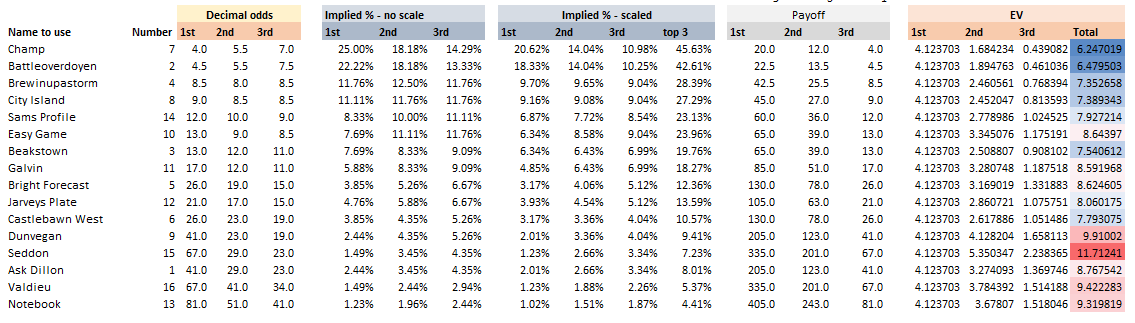 We see that the final column, Total EV, now has quite different values for each horse. In this case Horse 15, Seddon has an EV of 11.72. The favourite horse on the other hand - number 7 - only has an EV of 6.2. The intuitive explanation of this is that the probability of Seddon coming first is very low – this is the reflected in the long odds of 67, this then gives us a large multiplier, but the odds of the horse coming second or third are actually relatively less far out – the fact that it is not the favourite actually increases the odds of it coming in a position which is not 1st. But then if does come in 2nd or 3rd, we would still apply the same large multiplier for the odds of it coming 1st. This then gives us our 2nd edge – we can gain a positive EV by focusing. As a thought experiment, imagine we have a race with three horses – horse A is a clear favourite, horse B is an average horse, and horse C is clearly the weakest. By betting on horse C – the odds of it winning should be very low, so the multiple should be very high, but then this multiple will be applied even if it comes 2nd or 3rd, which is exactly where it is expected to finish. This therefore suggests our next potential strategy – select horses which maximise our EV using the implied probabilities of the horses coming 2nd, 3rd etc. So is this what I did? Well kind of.... The issue with this approach is that typically the horses that provide the best EV also have very long odds. In the race analysed above, our horse has an EV of 11.7, but it only has a 7% chance overall of coming in the top 3. In race two for example, the horse with the best EV actually only had a 2.7% chance of coming in the top 3. Since there are only 28 races in total, if each horse we selected only had a 2.7% chance of coming in, then the probability of us getting 0 points overall in the entire competition would then be: $(1-2.7 \%)^{28} = 48 \%$ So there is roughly a 50% chance we will get 0 points! Alternatively, if we selected the favourite every time, we could expect it to come top 3 almost every time, and thereby guarantee ourselves points most races, but it also has the lowest EV. So we have what appears to be a risk vs reward trade off. Pick outsiders and give ourselves the highest EV overall, or pick the favourites thereby reducing our overall EV but also reducing our volatility. This leads us neatly to attempt 3 - trying to think about how to maximise our probability of winning the competition rather than simply maximising EV for each race. Attempt 3 - EP curves From the work above, we now have our model of the position each horse will finish in each race – using the 1st, 2nd, and 3rd implied probabilities - and we have the payout for each horse – using the odds of the horse coming 1st. We can then bring our selection of horse and these probabilities together in a summary tab and simulate our daily score stochastically using a Monte Carlo method. To do this we just need to turn the implied probabilities into a CDF, and lookup the value of each position and repeat 10,000 times. The output for this then ends up looking like the following, where the value is the number of points we will for a given race. 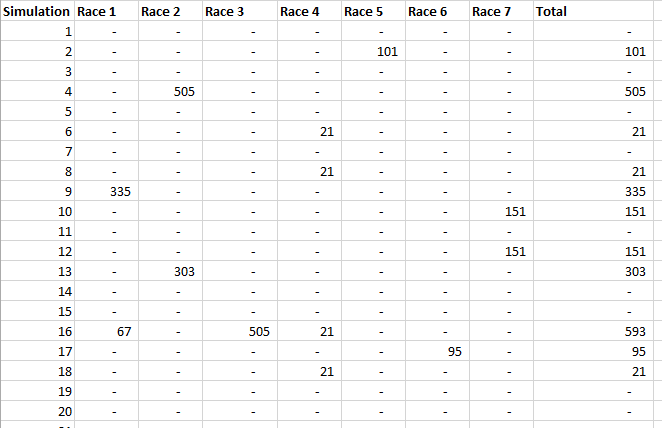 So we see that across this sample of 20 simulations, most days we to end up with 0 points overall, but a few days have very high scores. So far so good! The next step is to set up an EP table of the following, which looks like the following: 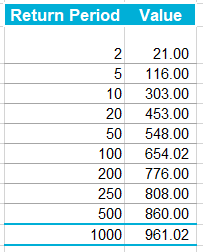 The EP table gives us the probability of exceeding various scores in the competition based on our horse selections. In this case, we see that there is a 1 in 20 chance of getting 453 points or greater in the day. This is useful even on its own – when I was deciding which horses to bet on, I simply played around with the selections until I got an EP table I was comfortable with. My reasoning was quite basic – I decided I wanted to maximise the 1 in 20 value. I wanted to give myself something like a 1/4 chance of winning the whole competition and a 3/4 chance of getting very few points. Since there were four days of races, dividing the 1/4 by another 4 suggests we should be looking at maximising the 1 in 20 level (I admit this reasoning was a bit rough, but it seemed to serve its purpose) The insight here is that the payout structure of the sweepstake is such that coming in the top 3 is all that matters, and in particular coming 1st is disproportionately rewarded. To see this, we can think of the daily selection of horses as attempting to maximise the EV of the overall prize rather than the EV of our overall score - maximising the EV of each race is only a means to this end. So we are actually interested in maximising the following: $0.7 * P(1st) + 0.2 + P(2nd) + 0.1 * P(3rd)$ Which will largely be dominated by P(1st), given the $0.7$ factor. This is largely the strategy I went for in the end. Attempt 4 - Game theory? I’ve brushed over one difficulty above; in order to maximise our prize EV we need to consider not just which strategy we should take, but how this strategy will fare against the strategies that other people will take. If everyone is maximising their 1 in 20 return period then there’s little point us doing exactly the same. Luckily for me, most people were doing little more than picking horses randomly. We could then formalise this assumption, and come up with a numerical solution to the problem above. To do this, we would simulate our returns for each day across 10,000 simulations as above, but this time we would compare ourselves against a ‘base strategy’ of random selection of horses and we would simulate this base strategy for the approximately 40 people who entered. Each simulation would then give us a ranking we would finish in the competition, Here is an example of what that would look like: 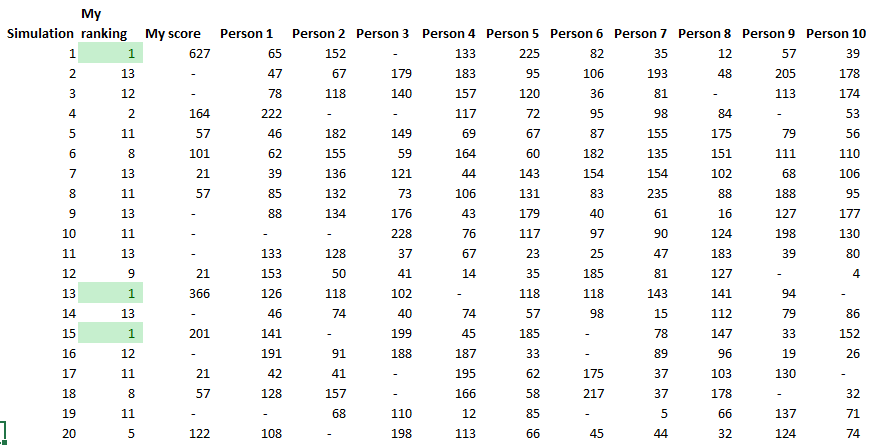 And we could then convert this into an EP table which would look like the following: 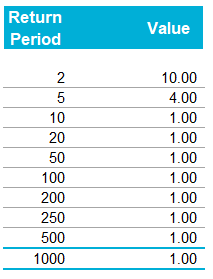 So we see that if we select these horses, we end up having somewhere between a 1 in 10 and a 1 in 5 chance of winning the competition. Now that we have all of this set up, we can then optimise our horse selection to target a particular return period. I didn’t actually end up setting up the above for the sweepstake, but I suspect it would have been an improvement on my approach Attempt 5 - Multiple day? There is a further refinement we can make to the above. We have so far only really been focusing on maximising our chance of winning by using a fixed strategy throughout the competition. But there is no reason we have to do this. After the first day, we should really be including the current scores of each competitor as part of our calculation of our ranking. i.e. if person 1 had a great day and now has 200 points but we had a bad day and still have 0 points, by accounting for this, the model should automatically increase our volatility i.e. start picking horses with longer odds so as to increase the chance of us catching up. If on the other hand, we had a really good first day and are now in the lead, the model should then automatically reduce our volatility and start selecting the favourites more often to help safely maintain our lead. How did it work in practice? I ended up placing 2nd, and taking 20% of the prize pot which was great! I was behind for most of the competition but then pulled back on the last day when a 66/1 came in 1st place, and I picked up 330 points off a single race. This may look miraculous, but is exactly how the model is supposed to work. Does that have any applicability to gambling generally? Unfortunately not, basically all of the work above is based on exploiting the specific scoring system of the sweepstake. There's no real way of apply this to gambling generally. Song Lyrics in China Mieville Novels8/3/2018 I just finished reading China Mieville's novel Kraken. It was really cool, it did take me a while to get into Mieville's voice, but once I got into the swing of it I really enjoyed it. Here is the blurb in case you are interested: "In the Darwin Centre at London’s Natural History Museum, Billy Harrow, a cephalopod specialist, is conducting a tour whose climax is meant to be the Centre’s prize specimen of a rare Architeuthis dux--better known as the Giant Squid. But Billy’s tour takes an unexpected turn when the squid suddenly and impossibly vanishes into thin air." One of the lines in the book struck me as surprisingly familiar. Here is the quote from the book: "She flicked through a pad by her bed, where she made notes of various summonings. A spaceape, all writhing tentacles, to stimulate her audio nerve directly? Too much attitude." After thinking about this for a moment, it clicked that this is a reference to a Burial song called Spaceape (from his self titled album). The line goes: "Living spaceapes, creatures, covered, smothered in writhing tentacles Stimulating the audio nerve directly" I couldn't find any reference online to the inclusion of Burial lyrics in Mieville's novels. Okay I thought, that's a cool a easter egg, but it got my thinking, are there any other song lyrics buried in Mieville's books? And if so, is there any way we can scan them automatically? Collecting Lyrics The first step was to get a database of song lyrics which we can use to scan the novels for, Unfortunately there is no easy place to find a database of song lyrics, so I was forced to scrape them from a lyrics site. I used the following free chrome extension web scraper which is very easy to use, and in my experience very reliable: webscraper.io/ After about 10 minutes of setting it up, and about an hour of leaving it to run. I had managed to scrape most of Burial's lyrics in to csv files. I also scraped lyrics by Kode9 and Spaceape so I could see if they were referenced anywhere. It's hard to know which artist I should look for, but both of these have been mentioned by Mieville in interviews. The web scraping add-in has an easy to use GUI. Here is a screenshot of what it looks like to set it up: 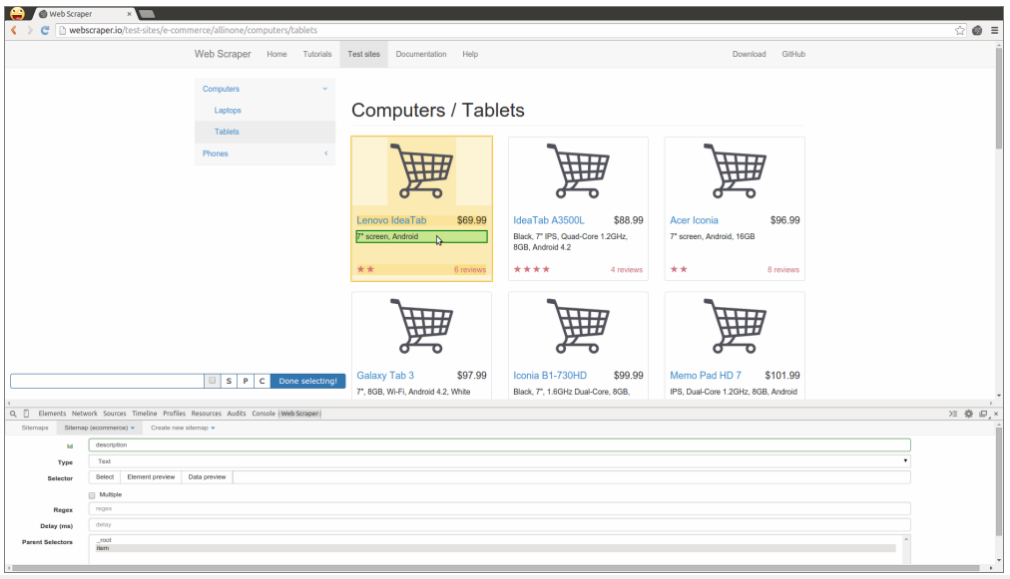 Ebooks in text format The next step was then to get his ebooks into a format that I could easily analyse. I assumed that I would need them in a csv format, but I actually got away with using .txt in the end. In order to get them into .txt. I used the built-in bulk converter in the following free ebook management program: calibre-ebook.com/ Here is a screenshot of Calibre. It is also very easy to use, and freely available online.  Analysing the text This is now the hardest part of the problem. We have electronic copies of China Mieville's novels in .txt format, and we have a collection of lyrics in .txt format which we would like to compare them against, how can we programmatically analyse whether Mieville references other Burial lyrics in one of his books? If we simply attempt to match entire strings, then we have the issue that we might miss out on some references due to small changes in word ordering or punctuation. For example, in the example above using Burial's Spaceape, the wording is slightly different and the tenses of some of the words have been changed, therefore looking for an exact match between lyrics and text will probably not work. If on the other hand we don't match complete strings, but just try to match words, then we will be overwhelmed by small words like 'the' and 'a' which will be used multiple times in both Burial's song lyrics, and in China Mieville's novels. There are two main approaches I came up with.to solve this problem. My first thought was to match individual words, generating a huge list of matches, and then to count the number of uses of each word in Mieville's novels, and then sorting by the words that match but which are also the most uncommon. For example I would imagine that Spaceape is only ever used once in all of Mieville's novels, giving us information about how unusual this word is. Combined with the fact that this word is also used in a Burial lyric, gives us enough information to assume that there is a high probability of a match, at this point we could investigate manually. I ultimately didn't go down this road. Instead, I had the idea to try to adapt plagiarism detection software to this problem. When you think about it, the two problems are actually quite similar. Plagiarism detection is about trying to automatically check two documents for similar phrases, without relying on complete matches. Open Source Plagiarism Detection I found the following free-to-use program created by Lou Bloomfield of the University of Virginia which is perfect for what I was trying to do. plagiarism.bloomfieldmedia.com/wordpress/ It compares two sets of files and then creates a side by side hyperlinked comparison, which can be viewed in chrome, highlighting the parts of the documents where a possible match has been detected. There are various settings you can tweak to specify how close of a match you are interested in. I have included a screenshot below of the section where the Spaceape line is detected. There were about 500 matches detected when I ran this, but it only took about a minute to scroll through and check up on the ones that looked significant. 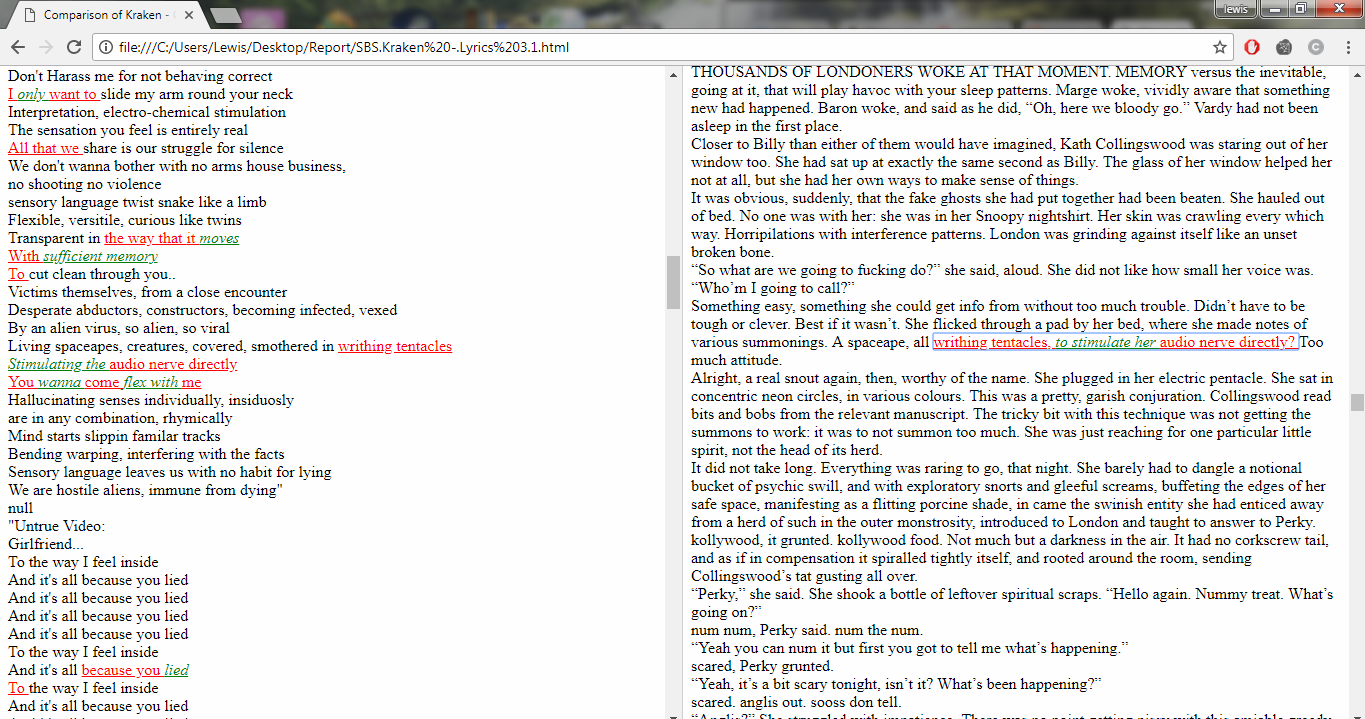 Results Ultimately, this analysis felt like a bit of a failure. These were the only lyrics I could find in all of his novels and while there is always the chance that I need to expand the number of artists I'm looking at, or refine my detection methods I imagine this is all there is. I still thought the process was quite cool so I thought I'd write up what I had done anyway. If you have any thoughts, let me know by leaving a comment. Drinking Game Analysis3/3/2018
When you are playing a drinking game, do you ever catch yourself calculating the probabilities of various events happening? If you are like most people the answer to that is probably "..... um..... no....... why would I ever do that...."
Okay, maybe that's not the kind of thing you think about when playing a drinking game. But I bet you think it would be interesting to know what the odds are anyway? No? Really? Still not that interested? .... Okay... well I find it interesting, so I'm going to write about it anyway. Eyes up/Eyes down I've only played this game a couple of times but it's pretty fun, it requires no equipment, and has quite a lot of drinking. All players sit in a circle, one player calls out "Eye's down" at which point everyone looks down, the same player then says "Eye's up" at which point everyone looks up at a random person in the circle. If the person you are looking at is also looking at you, then you both drink. Pretty simple. What is the probability that you will drink? Let's denote the event that you have matched someone with $M$. Then: $$P(M) = \frac{1}{n-1} $$ Where $n$ is the number of players.
To see that this is true, assume that everyone is picking a random person to look at, then it shouldn't matter who you are looking at, that person will always have $n-1$ people to pick from, and therefore a $ \frac{1}{n-1} $ chance of looking at you.
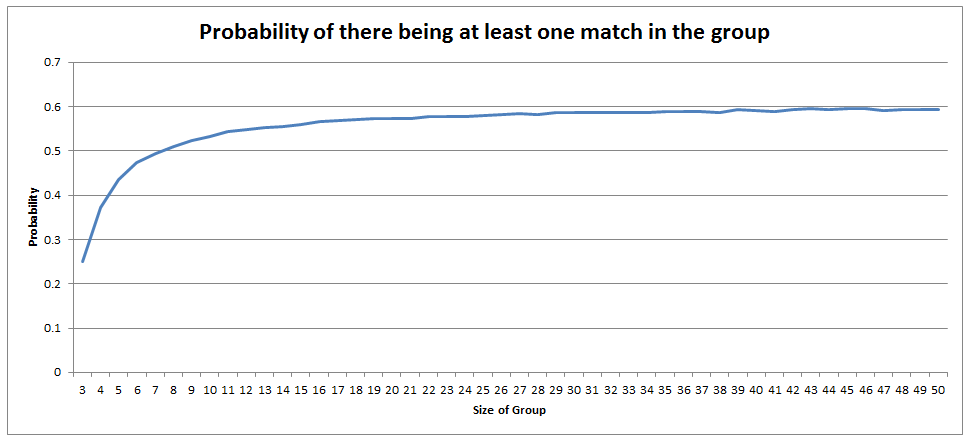
Of course people in real life tend not to pick a random person to look at, and even if they attempt to pick a random person, people have been shown to be terrible at picking randomly. But for the purposes of this analysis, unless we make this assumption, the only alternative would be to play the game hundreds of times, record how often matches are made, and then make an empirical claim. As fun as it sounds to play this game hundreds of times in a row, it would be better for your health to just assume a uniform spread of guesses. The fact that you have a $ \frac{1}{n-1} $ chance of getting a match means that the more people are playing the game, the less likely each person is to drink. Does this apply to the group as a whole though? What is the probability that someone in the group drinks? If we had a hundred people playing, then each individual would hardly ever drink. In fact you would expect them to drink once every $99$ goes. But would you expect it to also be unlikely that anyone at all drinks? I spent about an hour trying to calculate this and didn't get very far. Calculating through conditional probabilities doesn't seem to help, and I couldn't come up with a decent approach to count the permutations of all the possible ways of selecting pairings for elements in a set, such that there are no 2-cycles. In the end I gave up and just wrote a program to calculate the answer stochastically. Monte Carlo analysis really is such a versatile tool for problems like these. Anytime you can formulate the problem easily, but struggle to come up with an analytical solution, Monte Carlo analysis will probably work. Here is the table I generated of the probability of someone in the group drinking for a group of size n: 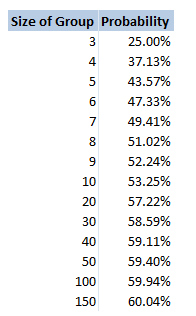
There is a definite trend here, if we plot the values on the chart it looks pretty clear that out solution converges to $0.6$. No idea why though! I might come back to this problem another time, but if anyone has any thoughts then please let me know.
Odds So this is not technically a drinking game, but is played quite often by people who are out drinking. The rules for this game are pretty simple, anytime you would like to dare someone to do something you say "odds of you doing this". The dare might be anything, from 'eating a spoon full of chilli powder, downing your drink, or even getting a tattoo (that last one is a real one I heard about from a friend who playing the game while travelling in Eastern Europe). The person you have challenged then gives you a number. They might say $20$, then each of you count down from $3$ and say an integer from $1$ to $20$ (or whatever number they selected). If you both said the same number, then they have to do the dare. Therefore the higher number you pick, the less likely it is that you will have to do the dare. What are the odds of you having to do whatever it is you are betting on, based on you selecting the number $n$? This is quite a straightforward problem, the answer is just $\frac{1} {n} $. I was playing this game last week with someone who thought the answer might be $\frac{1} {n^2} $. This would give a very different likelihood of having to do the dare. For example if you selected $20$, then you would have a $5 \%$ chance of having to do the dare, but according to my friend's calculation he thought you would have $0.25 \%$ chance of doing the dare. Here is a table showing the correct probabilities for various values of $n$. 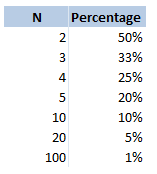
Dirty Pint Flip I wouldn't recommend playing this game to be honest. I played it in uni once, but it's a bit grim. All the players sit in a circle with a central pint glass in the middle, the players take it in turn to pour any amount of their own drink into the central pint glass as they would like, they then have to flip a coin and guess whether it will be heads or tails. If they get it right, then the game moves on to the person to their left, if they get it wrong, then they have to down the dirty pint. When I played it some people were drinking wine, some people were drinking beer... it was not a good combination. What is the probability that you will have to drink? This is quite straight forward, it is simply the probability that you will guess the coin flip correctly. Which is just $\frac{1}{2} $. What about the question of how much you will drink on average? That is, on average if you have to drink, how many people will have poured their drink into the glass before you drink? We can model this as a geometric distribution and calculate the probabilities of each possible number of people. Let's denote the number of people who have poured in before you, given you are about to drink as $N$, then:
$$N \sim Geo(0.5) $$
Giving us the following table: 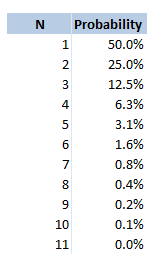
The expected value of the number of drinks is then the sumproduct of these two columns . This gives us a value of $2$. Therefore, if you have to drink, the average number of drinks that will have been poured into the pint is $2$. Two Dice Nominate This is another game I've only played a couple of times. And I'm not sure if it has a better name than the one I've given it, if you know of one then let me know. In this game, you sit in a circle with a range of drinks on the table, you take it in turns to nominate a person, a drink, and a number between $2$ and $12$. You then roll two dice and add them together. If you have rolled the correct number, the person you nominated drinks the drink you selected, if however you roll a double, then you drink that drink. If it is both a double and you get it correct, then you both have to drink. The reason that this game does not have much depth to it is that you can always just pick the most likely number to come up when rolling two dice. Here is a table showing the probability of each value coming up: 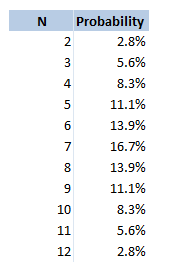
Therefore you might as well pick $7$ every single time! Is there anything else we can say about this game? We know that if we roll a double, then we have to drink the drink. What is the probability of you rolling a double in this game? The probability of this is always just $\frac{1}{6} $. Interesting this is the same probability as rolling the dice such that the sum is $7$. Therefore, if you do pick $7$, there is an equal chance of you and the person you are nominating drinking the drink. Recently I've been reading The Mathematics of Poker (2009, Bill Chen and Jerrod Ankenman) and I came across an interesting idea that I thought I'd write about. For me, understanding how to analyse this situation really gets to the heart of how I think about poker. I'd love to spend more time playing and studying poker but it's such a time-sink and I don't really have the oodles of free time it would require, but every now and again I'll still open up a poker book and read about something, this is one of those interesting topics I was reading about hopefully you find it as interesting as I do. Calling a shove pre-flop in heads up The scenario being analysed in the book is a relatively common situation, particularly in online poker where people are more inclined to shove than in real life games. The question is: How should we analyse whether to call when we have a moderately strong hand against an opponent who has gone all-in pre flop. Let's set up an example so that we have something concrete to talk about. Say we have pocket Kings pre flop, and our opponent goes all-in, how should we decide whether to call? Obviously without knowing our opponent's hand there is no 100% correct answer. There is however one very useful way of analysing the situation. Equity against a range We need to ask ourselves - what cards would are opponent go all-in with, and how does my current hand fare against that range? i.e. we need to calculate our equity against our opponent's range. We are adding another layer of stochastic uncertainty on the event, instead of trying to guess what hand our opponent has (which is almost impossible) we are trying to guess what kind of hands he might go all-in with (which is very much possible). We then take this extra level of uncertainty and calculate the correct mathematical way to proceed. On the one extreme, let's suppose that based on our read of how our opponent is playing, we might think that they would only go all-in with very strong hands, in this case just pocket Aces. We would then be a 4:1 underdog if we call with Ks, and we should definitely fold. (In order to calculate this we could use any standard poker calculator like the following) www.cardplayer.com/poker-tools/odds-calculator/texas-holdem One the other hand, suppose we know for a fact that our opponent has not looked at their cards at all but has still decided to go all in. In this case we should definitely call. The only cards we will be behind are pocket Aces, which make up a small fraction of the possible hands that our opponent could shove with, and we will be ahead or equal against all other possible hands. Therefore we would have a positive EV when calling. What if our read on our opponent's range is somewhere in between though? What we need to do is calculate our equity against each individual hand in our opponent's range, and then calculate the probability of our opponent having a given hand from that range. That is to say, in order to calculate the conditional expectation, we need to calculate the unconditional expectations against each hand and then multiply by the conditional probability of our opponent having that hand, given our belief about our opponent's range. Numerical Example Let's go back to our numerical example, and suppose that we have pocket Kings, and we put our opponent on either Pocket Aces, Kings, Queens, or Jacks. All of these hands are equally likely, so there is a 25% chance of our opponent having each hand. We can look up our equity against each hand (after you've been playing for a while, you naturally start to memorise hand equities anyway) Our probability of winning is then: $$P(A) * P(beating A) + P(K)*P(beating K) + P(Q)*P(beating Q) + P(J) * P(beating J)$$ Putting in our values: $$ 0.25*0.2 + 0.25*0.5 + 0.25*0.8 + 0.25*0.8 = 0.575.$$ We therefore see we have a positive expectation against this range, and should call. No one actually thinks like this in real games? It is a general misconception that professional poker is a game where players are trying to guess exactly what hand their opponent has, are constantly trying to bluff each other, or trying to pick up on subtle tells or signs that their opponent is or isn't bluffing. The more mundane truth is that poker is ultimately a game of imperfect information, where the better player is the one who can correctly interpret the betting information their opponent is giving them, and can then quickly and accurately make the kind of judgements described above during a game. Obviously poker players are not carrying out these calculations in their head to multiple decimal places in real time, what they will do though is review their hands after a game, calculate exactly what they should have done, and try to build up an intuition as to what the correct answer is, so that in the middle of a game they can quickly make decisions. Software to Analyse this situation Is there an easy software based method way of calculating our equity against a range? After I did a quick google there are a few programs that offer this type of analysis. For example: combonator.com/ www.power-equilab.com/ More interestingly though, I also found the following open source software, that can be adapted to carry out this type of analysis: github.com/zekyll/OMPEval At some point, I might try to use this code to set up a page on this website to let people analyse this situation. Myst - Solving the Gear Puzzle26/1/2018 Over the Christmas break, I finally got around to playing some Computer Games, which I unfortunately haven't done in ages. One really fun game (if you're like me and love difficult puzzles) is a game called Myst. 
It was originally released in 1993 as a point and click puzzle adventure game, but it has subsequently been remade, using the Unity engine, as a full 3d interactive game. I really liked the fact that there is no time limit, no danger of dying, just a cool story, interesting puzzles and relaxing music. One puzzle that I thought was cool involved aligning gear wheels. If you haven't played the game and don't want spoilers, then stop reading now. The Gear Puzzle We are given the contraption in the image below, and are told that we need to end up with the numbers 2,2,1 (reading from top to bottom). We have three levers we can pull, the left lever moves the top two gears left once, the right lever moves the bottom two gears right once. The lever on the back wall resets the machine. The starting values of the gears are 3,3,3. So how many times do we need to pull each lever in order to end up at 2,2,1? 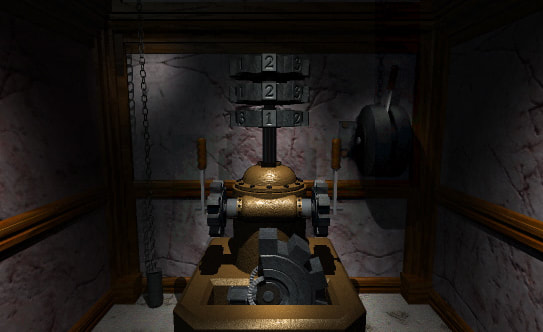
After playing around with it for a while I began to think that it might not even be possible to get to 2,2,1 using the two levers. Then I thought if that's true, can I prove it as well? Proof that the puzzle is impossible Instead of thinking of the value as $3$, let's call it $0$ instead. We can then think of the starting state as a vector:
$$ \begin{bmatrix} 0 \\ 0 \\ 0 \end{bmatrix} $$ And we can think of the left lever as adding on the following vector: $$ \begin{bmatrix} 1 \\ 1 \\ 0 \end{bmatrix} $$ And the right lever as adding the following vector: $$ \begin{bmatrix} 0 \\ 1 \\ 1 \end{bmatrix} $$ We need to work in $mod$ $3$ in order to properly account for the fact that after we go past $3$, we come back to $1$. Then the goal is to produce the state: $$ \begin{bmatrix} 2 \\ 2 \\ 1 \end{bmatrix} $$
To see that we are not able to do this with just the basic operations from the starting point we are given, note that the the sum of the first and third elements of our starting vector is equal to the second vector mod $3$, that is, $0 + 0 \equiv 0$ $(mod$ $3)$. For the vector we trying to create, the first and third is not congruent to the second element mod $3$. Instead we have $ 2 + 1 \equiv 0$ $(mod$ $3) $ rather than $2$.
The two operations we are applying to our starting vector preserve this congruence property, as it applies to both the vectors we are adding on as well. Therefore, we can conclude that this property is an invariant of the system, and because our goal does not satisfy this condition, we will never be able to reach:
$$ \begin{bmatrix} 2 \\ 2 \\ 1 \end{bmatrix} $$
by just using simple pulls of the lever. We need to realise this in order to force us to look for an alternative way to solve the puzzle. Otherwise we would probably just keep yanking on the levers in the hope that we will eventually get there. Once we realise this and start looking around, we are able to find another way to manipulate the machine, allowing us to make the numbers we need. The Newton - Pepys Problem17/6/2017 I always found it quite interesting that prior to the 19th century, Probability Theory was basically just a footnote to the study of gambling. The first time that Probability Theory was formalised in any systematic way at all was through the correspondence of three 17th century mathematicians, Pierre Fermat (famous for his last theorem), Blaise Pascal (famous for his wager), and Gerolamo Cardano (not actually famous at all) when analysing a problem in gambling called the problem of points. The problem of points is the problem of how to come up with a fair way to divide the winnings when betting on a game of chance which has interrupted before it can be finished. For example, let's say we are playing a game where we take it in turns to roll a dice and we record how many 6s we get, the first person who rolls a total of 10 6s wins. What happens if we are unable to finish the game, but one player has already rolled 8 6s, whereas their opponent has only rolled 2 6s. How should we divide the money in a fair way? Obviously it's unfair to just split the money 50-50 as the player with 8 6s has a much higher chance of winning, but at the same time, there is a chance that the player with only 2 6s might get lucky and still win, so we can't just give all the money to the player who is currently winning. The solution to the problem involves calculating the probability of each player winning given their current state, and then dividing the money proportionally. In order to answer this question in a systematic way, Fermat, Pascal, and Cardano formalised many of the basic principles of Probability Theory which we still use today. Newton - Pepys Problem The Newton - Pepys problem is another famous problem related to gambling and Probability Theory. It is named after a series of correspondence between Isaac Newton and Samuel Pepys, the famous diarist, in 1693. Pepys wrote to Newton asking for his opinion on a wager that he wanted to make. Which of the following three propositions has the greatest chance of success? A. Six fair dice are tossed independently and at least one “6” appears. B. Twelve fair dice are tossed independently and at least two “6”s appear. C. Eighteen fair dice are tossed independently and at least three “6”s appear. Pepys initially believed that Option C had the highest chance of success, followed by Option B, then Option A. Newton correctly answered that it was in fact the opposite order and that Option A was the most likely, Option C was the least likely. Wikipedia has the analytical solution to the problem. Which comes out as: 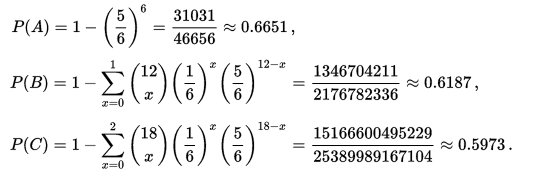 There's a few things I find really interesting about Newton and Pepys's exchange. The first is that it's cool to think of two very different historical figures such as Newton and Pepys being acquainted and corresponding with each other. For me, it makes them much more human and brings them to life the fact that they were both living in London and moving in the same social circles at the same time. Another interesting point is that once again, we see that Probability Theory has been advanced again due to the desire to make money from Gambling. Finally I think it's cool that Pepys was able to ask one of the greatest physicists of all time for a solution to the problem, yet the solution is trivial now. Luckily Newton was able to provide Pepys with an answer, though it might have taken Newton quite a while to calculate, especially for Option C. But you could give the problem to any student now who has access to a computer and they would be able to give you an answer in minutes by just simulating the problem stochastically. Stochastic modelling always seemed like a new form of empiricism to me, whereas calculating the answer with a computer analytically still seems like a-priori reasoning. Newton probably did compute the answer analytically by hand, but he would not have been able to simulate 50,000 simulations of the game by hand. It's fundamentally a different kind of reasoning, and the closest he could have got would have been to play the game 50,000 times and record the average. Stochastic Model To calculate this myself I set up a Monte Carlo model of the game and simulated 50,000 rolls of the dice to calculate the expected probability of each of these three options. 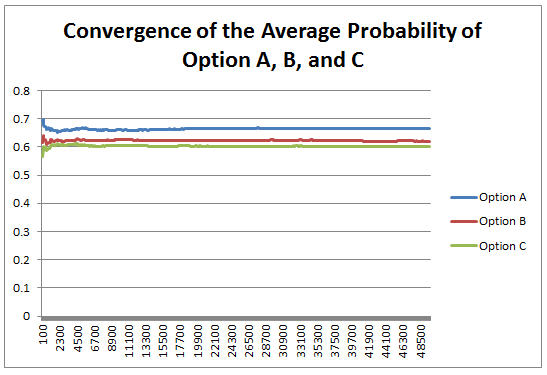 We can clearly see from this graph that Option A is the most likely Option of the three, with Option C being the least likely. We can tell all of this by just setting up a model that takes 5 minutes to build and give an answer in seconds. It makes you wonder what Newton would have been able to manage if he had access to the computing power that we take for granted now. Sources: Wikipedia: en.wikipedia.org/wiki/Newton%E2%80%93Pepys_problem An Article by Stephen Stigler: arxiv.org/pdf/math/0701089.pdf Poker Strategy - Playing with cards up21/2/2017 I've been playing quite a lot of Poker recently, and the more Poker I've played, the more I've come to realise that it's actually a very deep game. One of the interesting features of Poker that makes it so complex is the inability to see each other's cards (this may sound like I'm stating the obvious but bear with me). Let's consider a thought experiment, what if we played Poker against each other without hiding our cards? I show below why it would still be a fairly difficult game to play well. The fact that we also can't see each other's cards just adds another level of uncertainty to the underlying complexity.
Incomplete Information In technical terms Poker is a game of incomplete information. An example of a deep game which has complete information is Chess. In Chess we can see all our opponents pieces, and they can see all our pieces. The fact that we have perfect information when playing Chess in no way makes the game trivial. Heads Up No Limit Texas Holdem Let's suppose we are playing heads up No limit Holdem (No-limit Texas Holdem is the proper name for the game most people think of when they think of Poker, heads up just means that there are only two of playing). Let's first consider the case where we can't see each other's cards. Suppose we have J♣6♣, and the flop is 10♣ 9♣ 8♠ there is $£100$ in the pot, we have a stack of $£200$, and our opponent also has a stack of $£200$. Our opponent goes all-in, what should we do? Obviously there is no 100% correct answer to this question, and if we were playing in real life, we'd have to consider a large number of other variables. How likely do we think our opponent is to bluff? What was the betting pre flop? Do we think we are a better player than our opponent overall, and therefore want to reduce the variance of the game? Are we the two short stacked players in a tournament? All of the above considerations are what make poker such an interesting game. Playing with Complete Information Now let's suppose that we can see our opponent's cards. For example, imagine we are in the same situation as above, but now our opponent shows us his cards, they have 5♥ 5♣. What should we do now? It turns out in this case, there is actually a mathematically correct way of playing, but it is by no means obvious what that is. At the moment our opponent has a better hand - they have a pair of 5s, and we do not have anything. What we do have though is the possibility of making a better hand. We can reason as follows. We will win if one of the following happens:
We can calculate the probability of one of these happening, and we also know how much we will win if one of them occurs, we can therefore calculate the expected value of calling our opponents all-in. It turns out that, the probability of us winning this hand if we call is $68.38$%, the probability of there being a split pot if we call is $1.82$%, and the probability of us losing the pot if we call is $29.08$%. In order to see how to calculate this, we note that there are $46$ cards remaining in the deck, and that we can calculate the probability of getting the cards we need for the $4$ way of winning. Now that we have the probability of winning, we can compare this to the pay off should we win. Expected Value of calling The Expected Value is the average amount we would expect to win over a large sample of hands if we make a given decision. In this case we calculate the expected value as: $EV = 0.6838 * 300 - 0.2908 *200 = 146.98$ Therefore, over a large enough number of hands, if we are presented with this exact situation repeatedly and we take the average of how much we win or lose, we would expect the amount we win to converge to $£146.98$ The thing about this I find interesting is that when you are playing in real life, even when you can see your opponent's cards, unless you have access to an EV calculator it is still very difficult to determine the correct way to play, and this difficulty is only compounded by the fact that we also can't see our opponent's card. In order to play Poker well when playing with Incomplete Information, we have to attempt to reason about who has the better cards, whilst bearing in mind this underlying uncertainty which is present even when playing with Complete Information. Solving a Snake Cube Puzzle19/12/2016
My colleague at work gave me a snake cube puzzle to try to solve, and if you haven't tried, they are a lot harder to solve than they look.
After trying and failing for about 10 minutes to solve the puzzle, I had a great idea, why not waste a couple of hours writing a program to solve it for me? And then a couple of hours turned into a couple more hours, but I got there in the end! The aim is to wrap the snake into a 3x3x3 cube. Here is what the snake puzzle looks like when it is unwrapped. 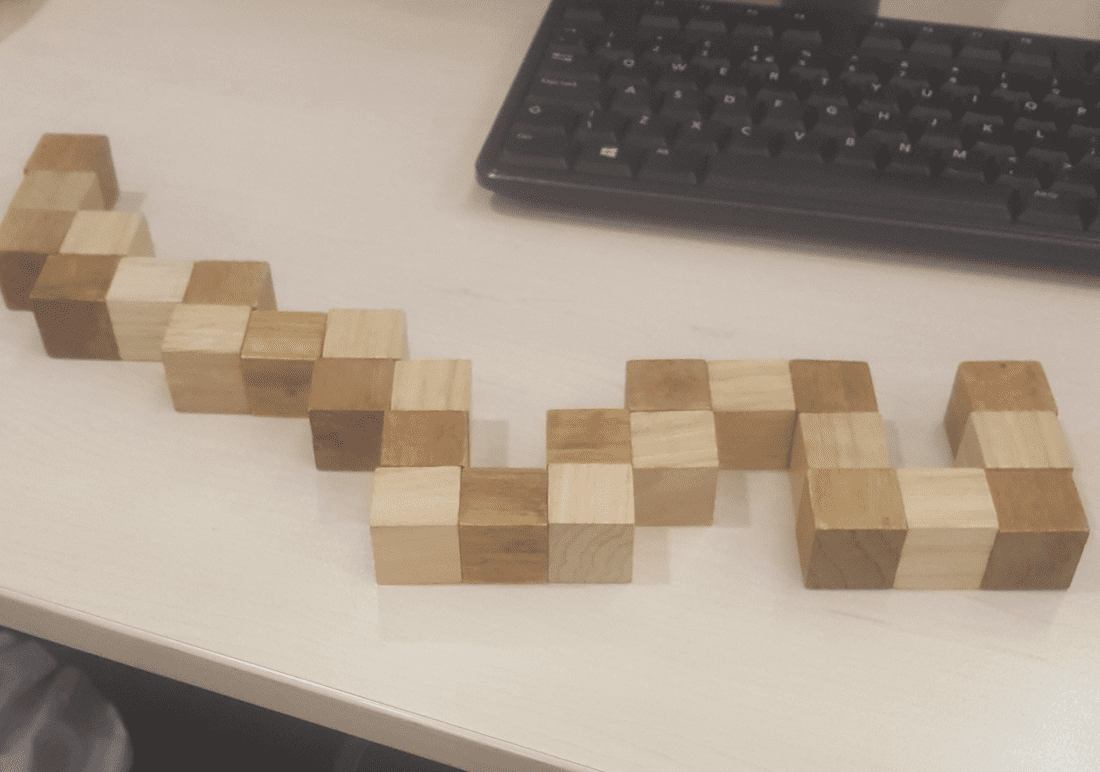
How does the Program work? There are two main approaches to solving the puzzle programmatically, you could either systematically enumerate all permutations of the snake, or randomly try different permutations until you find one that works. I went with the second option. which seemed like it would probably be computationally slower, but easier to program. I decided to write the code in Python, it works by randomly twisting the snake one joint at a time, and restarting everytime the snake either crosses itself or goes outside a 3x3x3 grid. The code runs 100,000 simulations in approximately 20 seconds on my laptop, which turns out to be just about fast enough to get an answer when you leave the program to run for a couple of hours. The code:
from random import randint
import time

def f(x):
    return {
        1: 1,
        2: 2,
        11: 0,
        12: 2,
        21: 0,
        22: 1,
    }[x]

def drandomu():
    drandomint = randint(1, 2)
    if drandomint == 1:
        drandomint = -1
    else:
        drandomint = 1
    return drandomint

def drandom(iDirection):
    drandomint1 = f(iDirection * 10 + randint(1, 2))
    return drandomint1

CurrentTime = time.clock()
vArray = [[[0 for x1 in range(3)] for y1 in range(3)] for z1 in range(3)]
vMaxArray = [[[0 for x2 in range(3)] for y2 in range(3)] for z2 in range(3)]


iMax = 0
iTotalBlock = 1
vChain = [3, 1, 1, 2, 1, 2, 1, 1, 2, 2, 1, 1, 1, 2, 2, 2, 2]
m = 1000000
limit = int(m * 1)
for lSim in range(limit):
    try:
        GiveUp = "False"
        iDirection = 0
        iTotalBlock = 1
        vCurrent = [0, 0, 0]
        for x in range(3):
            for y in range(3):
                for z in range(3):
                    vArray[x][y][z] = 0
        for iLink in range(17):
            if GiveUp == "False":
                if iLink == 0:
                    for iBlock in range(vChain[iLink]):
                        if iBlock > 0:
                            vCurrent[0] += 1
                        vArray[vCurrent[0]][vCurrent[1]][vCurrent[2]] = iTotalBlock
                        iTotalBlock += 1
                else:
                    iDirection = drandom(iDirection)
                    iUpOrDown = drandomu()
                    for iBlock in range(vChain[iLink]):
                        if vCurrent[iDirection] == 0:
                            iUpOrDown = 1
                        vCurrent[iDirection] += iUpOrDown
                        if vArray[vCurrent[0]][vCurrent[1]][vCurrent[2]] != 0:
                            if iMax < iTotalBlock:
                                iMax = iTotalBlock
                                for x in range(3):
                                    for y in range(3):
                                        for z in range(3):
                                            vMaxArray[x][y][z] = vArray[x][y][z]
                            GiveUp = "True1"
                            break
                        else:
                            vArray[vCurrent[0]][vCurrent[1]][vCurrent[2]] = iTotalBlock
                            iTotalBlock += 1

        iTotalBlock = 0
        for x in range(3):
            for y in range(3):
                for z in range(3):
                    iTotalBlock += vArray[x][y][z]

        if iTotalBlock == 378:
            print(vArray)
    except:
        pass

print(int(time.clock() - CurrentTime), "Seconds")
print(int((time.clock() - CurrentTime)/60), "Minutes")

for x in range(3):
    print(vMaxArray[x])

print(iMax)
The Solution The program eventually gave me the following layout as a solution: [[1, 16, 23], [18, 17, 22], [19, 20, 21]] [[2, 15, 24], [5, 6, 7], [10, 9, 8]] [[3, 14, 25], [4, 13, 26], [11, 12, 27]] The easiest way to think about the solution the program gives is to think of the three blocks of three digits on the left as the bottom layer, the second block of three digits as the second layer, and then the third block of three as the third layer. So the 4th block is directly abov the third block. Here is the completed puzzle: 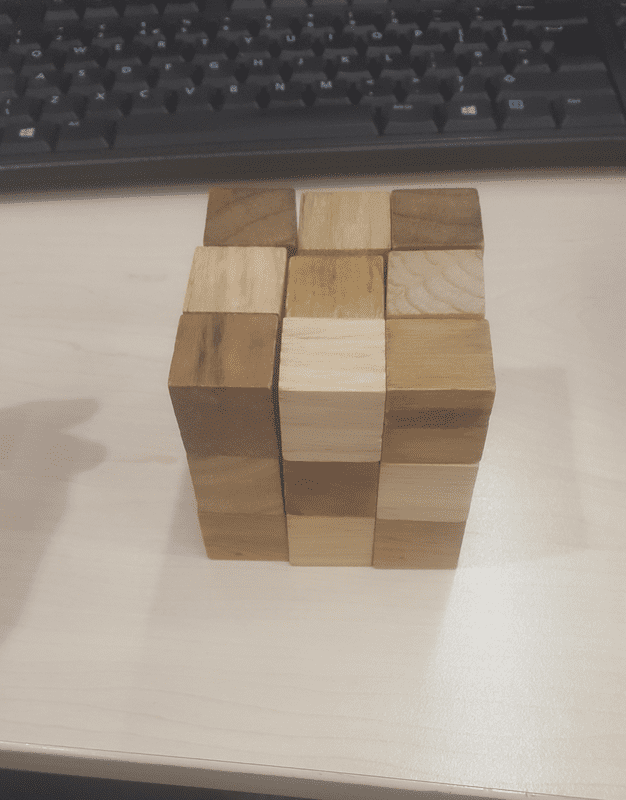
There was an interesting article in the Economist last week (July 23rd edition) about the growing dependency ratio in the developed world and whether this is sustainable. (the dependency ratio is the ratio of the number of working aged people to number of non-working age people).
It was definitely an interesting read, and I will post a link below, it raises interesting questions about the transfer of wealth from one generation to the next and the fairness of this transfer in a system where there are fewer working age people paying in. One thing about the article that struck me though was that the UN Population Division publishes estimates of the working age population all the way out to 2100! I can't even predict what I will have for lunch tomorrow. Is this a case of the UN being wildly optimistic about their modelling skills? Or perhaps over such a large data sample (the entire human population) the law of large numbers prevails and we can pick out some clear trends which we expect to continue in the future. Let's try to look into how good these population models are. My first step was to try to find estimates of population growth published by the UN Population Division in the past and see how accurate they had been. Every couple of years the UN Population Division publishes a report on World Population Prospects, I managed to find report going back to 2000, link below for the 2000 addition: Previous Estimates I found as many of these reports as I could and chucked the data into a table. Luckily the reports are fairly standardised and it is possible to look at the sequence of estimates. 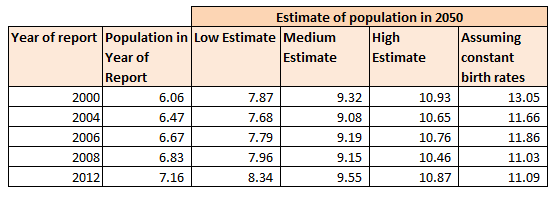
We see that the best estimate of the World Population in 2050 has actually been relatively stable since the year 2000. The standard deviation of the medium estimate is only in the range of 200m, which to me seems like a reasonable volatility for such a far reaching statistic.
An interesting aspect of this data is the drop in the last column between 2000 and 2004. The final column represents the estimate of the population in 2050 assuming that birth rates do not decline. Since we do not have a large shift in the medium estimate between these two dates, this drop in birth rates must have been factored in for the 2000 analysis. So to answer the original question - how accurate can we be about Population Growth - so far pretty accurate. If the UN is able to accurately model the change in birth rates, then perhaps there is hope that they will be able to model population as a whole accurately.
Link to the original article from the economist:
Monte Carlo Tic Tac Toe Engine24/7/2016
Since setting up the approximation of $\pi$ using the Monte Carlo technique of sampling inside a circle, I've been playing around with applying Monte Carlo methods to other problems.
One problem I thought it would be fun to play around with was creating an AI engine that uses Monte Carlo rather than deterministic methods to run. My first thought was to look at a chess engine, I've always wanted to set one up, but after playing around with it for a while I realised setting up the actual game engine was going to be a substantial amount of work before even thinking about the AI. Therefore I shelved that for the time being. The next game I decided to look at Tic-Tac-Toe or Noughts and Crosses which is on the opposite end of the spectrum in terms of complexity of rules. Optimal Strategies As every school age kid quickly learns, there is an optimal strategy for playing Tic-Tac-Toe. In case anyone has forgotten it can easily found online, however programming in the strategy would have been quite tedious, and not as fun as messing around with a stochastic solution. I thought it was interesting that a Monte Carlo engine, if it can be programmed to play the game well without even being told what the optimal strategy is, should replicate this strategy simply by selecting what it believes is the optimal move based on its own analysis. It can do all of this without ever truly knowing what the strategy is. I decided to write the engine in VBA, which is not a great development language generally. But meant that I could stick the game into a Spreadsheet which seemed like a fun thing to do. Here's a screenshot of the game: 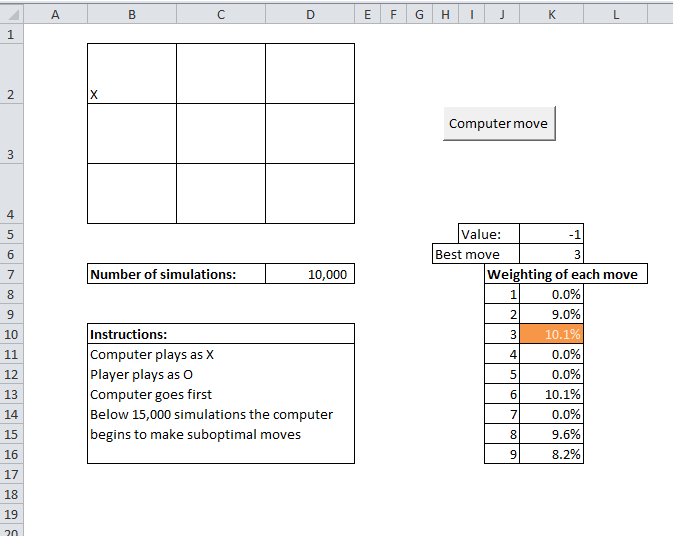
How it works The way the engine works is each time the computer is about to move, it uses the current state of the grid, and plays out a large number of random games (for each move it makes a random selection for itself and then a random selection for the player until one side wins or it is a draw). The computer tracks who wins each game and more importantly, for each of the possible next moves for the computer, whether it eventually ends in a win, draw or loss. The computer repeats this process a large number of times (the default being 10,000), each time assigning a value to the starting move of +1 if the computer eventually wins the game, +0.5 if the game ends in a draw, and 0 if the computer losses the game. The computer keeps a running total of the value assigned to each starting move. Once the simulation of random games is completed, the computer selects the move with the highest value, this should correspond to the starting move that is the most likely to led to a victory or a draw, I've linked below to the Excel file with the game inside:
And here is the source code in VBA:
Future Development Something that I would like to explore in the future is the use of more efficient algorithms for analysing the best move. For example, apparently alpha-beta pruning can be used to focus on the moves that look the most promising rather than spending an equal amount of time looking at all moves. I would also like to make a web based version of the game at some point., Lyric Analysis - Why Justin Bieber is better than Metallica, but the Beatles are the greatest.29/6/2016
"I’m not a businessman
I’m a business, man! Let me handle my business, damn" Kanye West ft Jay.z - Diamonds from Sierra Leone “It's easier to run Replacing this pain with something numb It's so much easier to go Than face all this pain here all alone.” Linkin Park - Easier to Run Recently I've really been getting into hip hop, one thing that really struck me about hip hop, is that contary to popular perception. hip hop is on the whole surprisingly upbeat, especially when contrasted with rock and metal which I listened to a lot of growing up. In the spirit of being scientific I thought I would try to quantify this difference. My plan was: 1) Get hold of a sample of lyrics from different artists of sufficient size. 2) Come up with a method for analysing how positive or negative the lyrics are. 3) Run the analysis on the lyrics and collate the results, Step 1 - Collect data So the first step was to obtain a sample of lyrics. This was actually harder than I thought it would be. There are plenty of websites which contain song lyrics, however I was looking for a large collection of songs and artists, and I didn't want to have to trawl through hundreds of webpages by hand. The process of automating the collection of data from websites is called web scraping. I have played around with webs scraping before using Python, but I found it to be very fiddly to set up and not very reliable. This was a couple of years ago though, and it turns out that since then there have been a number of new tools which make the whole process easier. I ended up using a tool called 'Web Scraper', website below: Web Scraper is an add-in to Chrome with an easy to use graphical interface, that can export extracts directly to .csv files. In total I managed to collect lyrics from about 4,000 songs across 12 artists. Whilst I did manage to automate the process, it was still quite slow going as many websites have anti-scraping technology that blocks you out if you take too much data too quickly. I might try to expand this sample at a later date, but we can already see some clear trends emerging just from these artists. Step 2 - Develop a method for analysing the lyrics. Trying to program a computer to understand the semantic meaning of human generated text is a big area of research in the field of Computer Science. It is called 'Natural Language Processing', or NLP for short, there are many advanced methods within NLP being developed at the moment, some of the approaches involve Machine Learning, statistical analysis or other complex methods. For a good introduction the Wikipedia page gives a helpful overview. However, I was just looking for a very basic method that would allow for a broad brush analysis. I therefore decided to just use the relative frequency of words with positive or negative connotations within the lyrics as a proxy for how positive or negative the lyrics were as a whole. The obvious weakness of this approach is that just because there are positive words within a sentence, does not necessarily imply the meaning of the sentence is positive as a whole. For example, take the sentence 'This is not fun', an analysis of this sentence just on the basis of the words contained in it would suggest that it is a positive sentence, given we have the word 'fun' in the sentence. The obvious way to counter this would be to start looking at phrases instead. So 'not fun' would be given a negative connotation. Trying to look at phrases rather than words, adds a large degree of additional complexity to the analysis though, and given that all the artist should be exposed to roughly the same degree of false positives and false negatives, and given that we still get interesting results just using this very basic heuristic I decided to stick with it in this case. I might come back to this at a later date though. So given we are just interested in looking at words rather than phrases, I was looking for a dictionary of words with an indicator of whether the word is positive or negative. It turns out that people have already worked on this problem, and free dictionaries are available online. I found the website of Prof. Bill Mcdonald of the University of Notre Dame in Indiana, USA. He has developed word lists for use in automating the analysis of financial statements, all the lists can be found in the following link: I took Prof. McDonald's list, added in a number of additional words that appear frequently in song lyrics but were not including in the word list. (For example ballin' came up a lot in Hip Hop, but unfortunately is under used in financial statements). Step 3 - Run the analysis on the data and collate the results Here are the results of my analysis: 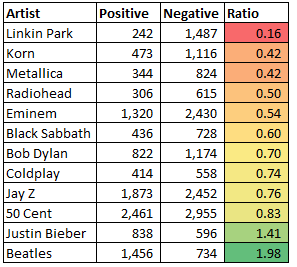
As we can see, Jay Z and 50 Cent, our representative Hip Hop artists are clearly above the Metal artists in terms of the relative frequency of positive over negative words in their music. We can see that the Metal artists are clustered at the bottom of the table. One interesting feature of the results, which perhaps should not have been a surprise, was that pop music, i.e. Justin Bieber and the Beatles, were actually the clear winners on these terms. Grouping the artists together into genres further emphasises the clear positioning of the genres. 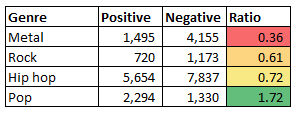
So there we have it, Hip Hop is more positive than Rock or Metal. And Justin Bieber is better than Metallica, but the Beatles are the most positive band of all! Solving the GCHQ Christmas Puzzle part 319/1/2016
Part 3 consists of four questions. The answer to each puzzle is a single word, which can be used to create a URL."
2. Sum: pest + √(unfixed - riots) = ? Hmm, how can we do maths with words? I played around with trying to assign meaning to the sentence, kinda like the old joke that you can show that $women = evil$. Women take up time and money, therefore: $Women = Time * Money$ Time is equal to money: $Time = Money$ Therefore: $Women = Money^2$ But we also know that money is the root of all evil: $Money = \sqrt{Evil}$ Therefore: $Women = \sqrt{{Evil}^2}$ Simplifying: $Women = Evil$ I wasn't able to come up with anything along this vein, therefore we need to try a new approach. If we are committing to the idea that the words represent numbers somehow then we need to try to assign numbers to these words. I played around with a few ideas before trying anagrams. I noticed that pest is an anagram of sept. (Which I initially thought related to September and hence 9, but is also French for 7). Running with this idea, we also note that unfixed is an anagram for dix-neuf, and riots is an anagram for trois. So our equation becomes: $ 7 + \sqrt{19 - 3} = 7 + \sqrt{16} = 7 + 4 = 11$ Therefore our answer is onze. Since the other words were anagrams this is probably an anagram as well. Therefore I think the solution is zone. On to the next question. 3. Samuel says: if agony is the opposite of denial, and witty is the opposite of tepid, then what is the opposite of smart? Samuel says is a strange way to start this question. normally you'd say 'simon says', is this a hint? Who is Samuel? The first thing that comes to my mind is Samuel Pepys, the famous diarist. I wonder if he has any famous quotes that shed light on the question. A quick google doesn't reveal anything. Perhaps this is a different Samuel? Looking up other famous Samuels leads us to another clue - Samuel Morse. Once we know that we are talking about morse code, the obvious next step is to convert the words we've been given into morse code. We find that: Agony = ... -- .- .-. - Denial = -.. . -. .. .- .-.. Witty = .-- .. - - -.-- Tepid = - . .--. .. -.. Smart = ... -- .- .-. - Now we can hopefully see how this works - we replace the dots for dashes. Therefore our new word is: ---..-.-.-.- This word doesn't have the spaces in it. After some experimentation we conclude that the word that is the opposite of smart is often. 4. The answers to the following cryptic crossword clues are all words of the same length. We have provided the first four clues only. What is the seventh and last answer?
The next question is a series of cryptic crosswords - which is a bit of an issue since I've never done a cryptic crossword before. We've therefore got two options - learn how to solve cryptic crosswords, or find another way to progress. I attempted to learn how to do cryptic crosswords but I really struggled to solve the crosswords here, though I do now know how to solve cryptic crosswords and can solve a few questions in a newspaper. Therefore we need to find another way to solve this puzzle. The website provides us with a way to check that our answers are correct. We can input our answers into the boxes provided and click the 'check answer' button and the website will tell us if we have the correct solutions. Hmm.. wonder how this words. When we view page source and look at the code we see that there is actually a check function. For a given string of letters this function returns two unique numbers. The website takes our answers, calculates the unique numbers associated with it, and checks if the numbers generated are equal to 608334672 and 46009587. So it's simple right? We just work out the string generates these two numbers and this will give us the answer. The problem with this is that the function that generates these numbers is something called a cryptographic hash function. Which is a function which for any input will return a result of a fixed length which is practically impossible to invert. We have some extra information that help us though - we know the format of the answer, and we know the answers to three out of the four questions. So we know the input to the hash function is of the form: "cubzoneoften" + new word I therefore set up a dictionary attack in the following file:
This file works by letting you open a .txt file containing a list of words. The code will then loop through the words in the text file, calculating the results of the hash function. After running this file we find out that the word we are looking for is layered. And the url of the next stage of the challange is:
|
AuthorI work as an actuary and underwriter at a global reinsurer in London. Categories
All
Archives
April 2024
|
||||
 RSS Feed