|
So I finally finished Thomas Piketty's book - Capital in the 21st Century, and I thought I'd write up an interesting result that Piketty mentions, but does not elaborate on. Given the book is already 700 pages, it's probably for the best that he drew the line somewhere.
The result is specifically, that under basic models of the development of distribution of wealth in a society, it can be shown that when growth is equal to $g$, and return on capital is equal to $r$, then the distribution of wealth tends towards a Pareto distribution with parameter $r-g$. That sounds pretty interesting right? My notes below are largely based on following paper by Charles I. Jones of Stanford Business School, my addition is to derive the assumption of an exponential distribution of income from more basic assumptions about labour and capital income. Link to Jones's paper [1]
Piketty also adds colour by tying his observations to the literature written at the time (Austen, Dumas, Balzac), and how the assumptions made by the authors around how money, income and capital work are also reflected in the economic data that Piketty obtained.
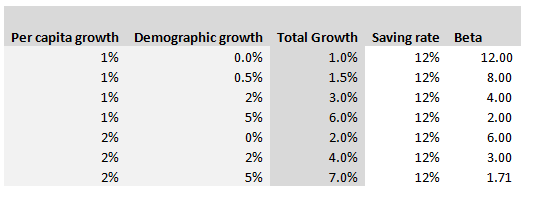
Hopefully I've convinced you Piketty's programme is a worthwhile one, but that still leaves the fundamental question - is his analysis correct? That's a much harder question to answer, and to be honest I really don't feel qualified to pass judgement on the entirety of the book, other than to say it strikes me as pretty convincing from the limited amount of time I've spent on it. In an attempt to contribute in some small way to the larger conversation around Piketty's work, I thought I'd write about one specific argument that Piketty makes that I found less convincing than other parts of the book. Around 120 pages in, Piketty introduces what he calls the ‘Second Fundamental Law of Capitalism’, and this is where I started having difficulties in following his argument. The Second Fundamental Law of Capitalism The rule is defined as follows: $$ B = \frac{s} { g} $$ Where $B$ , as in Piketty’s first fundamental rule, is defined as the ratio of Capital (the total stock of public and private wealth in the economy) to Income (NNP): $$B = \frac{ \text{Capital}}{\text{Income}}$$ And where $g$ is the growth rate, and $s$ is the saving rate. Unlike the first rule which is an accounting identity, and therefore true by definition, the second rule is only true ‘in the long run’. It is an equilibrium that the market will move to over time, and the following argument is given by Piketty: “The argument is elementary. Let me illustrate it with an example. In concrete terms: if a country is saving 12 percent of its income every year, and if its initial capital stock is equal to six years of income, then the capital stock will grow at 2 percent a year, thus at exactly the same rate as national income, so that the capital/income ratio will remain stable. By contrast, if the capital stock is less than six years of income, then a savings rate of 12 percent will cause the capital stock to grow at a rate greater than 2 percent a year and therefore faster than income, so that the capital/income ratio will increase until it attains its equilibrium level. Conversely, if the capital stock is greater than six years of annual income, then a savings rate of 12 percent implies that capital is growing at less than 2 percent a year, so that the capital/income ratio cannot be maintained at that level and will therefore decrease until it reaches equilibrium.” I’ve got to admit that this was the first part in the book where I really struggled to follow Piketty’s reasoning – possibly this was obvious to other people, but it wasn’t to me! Analysis – what does he mean? Before we get any further, let’s unpick exactly what Piketty means by all the terms in his formulation of the law: Income = Net national product = Gross Net product *0.9 (where the factor of 0.9 is to account for depreciation of Capital) $g$ = growth rate, but growth of what? Here it is specifically growth in income, so while this is not exactly the same as GDP growth it’s pretty close. If we assume net exports do not change, and the depreciation factor (0.9) is fixed, then the two will be equal. $s$ = saving rate – by definition this is the ratio of additional capital divided by income. Since income here is net of depreciation, we are already subtracting capital depreciation from income and not including this in our saving rate. Let’s play around with a few values, splitting growth $g$, into per capita growth and demographic growth we get the following. Note that Total growth is simply the sum of demographic and per capita growth, and Beta is calculated from the other values using the law.
So why does Piketty introduce this law?
The argument that Piketty is intending to tease out from this equality is the following:
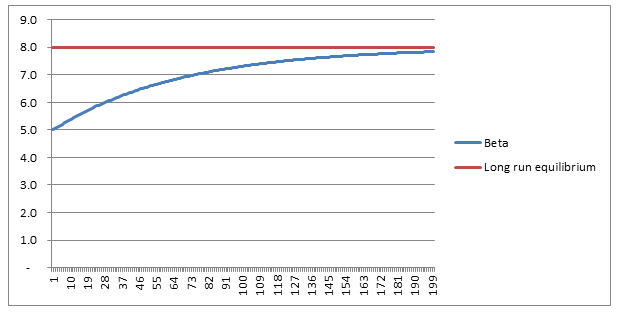
In fact using $g=1.5 \%$ as a long term average, we can expect Beta to crystallise around a Beta of $8$! Much higher than it has been for the past 100 years. Analysis - convergence As Piketty is quick to point out, this is a long run equilibrium towards which an economy will move. Moreover, it should be noted that the convergence of this process is incredibly slow. Here is a graph plotting the evolution of Beta, from a starting point of 5, under the assumption of $g=1.5 \%$, $s = 12 \%$:
So we see that after 30 years ( i.e. approx. one generation), Beta has only increased from its starting point of $5$ to around $6$, it then takes another generation and a half to get to $7$, which is still short of its long run equilibrium of $8$.
Analysis - Is this rule true? Piketty is of course going to want to use his formula to say interesting things about the historic evolution of the Capital/Income ratio, and also use it to help predict future movements in Beta. I think this is where we start to push the boundaries of what we can easily reason, without first slowing down and methodically examining our implicit assumptions. For example – is a fixed saving rate (independent of changes in both Beta, and Growth) reasonable? Remember that the saving rate here is a saving rate on net income. So that as Beta increases, we are already having to put more money into upkeep of our current level of capital, so that a fixed net saving rate is actually consistent with an increasing gross saving rate, not a fixed gross saving rate. An increasing gross saving rate might be a reasonable assumption or it might not – this then becomes an empirical question rather than something we can reason about a priori. Another question is how the law performs for very low rates of $g$, which is in fact how Piketty is intending to use the equation. By inspection, we can see that:
As $g \rightarrow 0$, $B \rightarrow \infty $.
What is the mechanism by which this occurs in practice? It’s simply that if GDP does not grow from one year to the next, but the net saving rate is still positive, then the stock of capital will still increase, however income has not increased. This does however mean that an ever increasing share of the economy is going towards paying for capital depreciation.
Conclusion
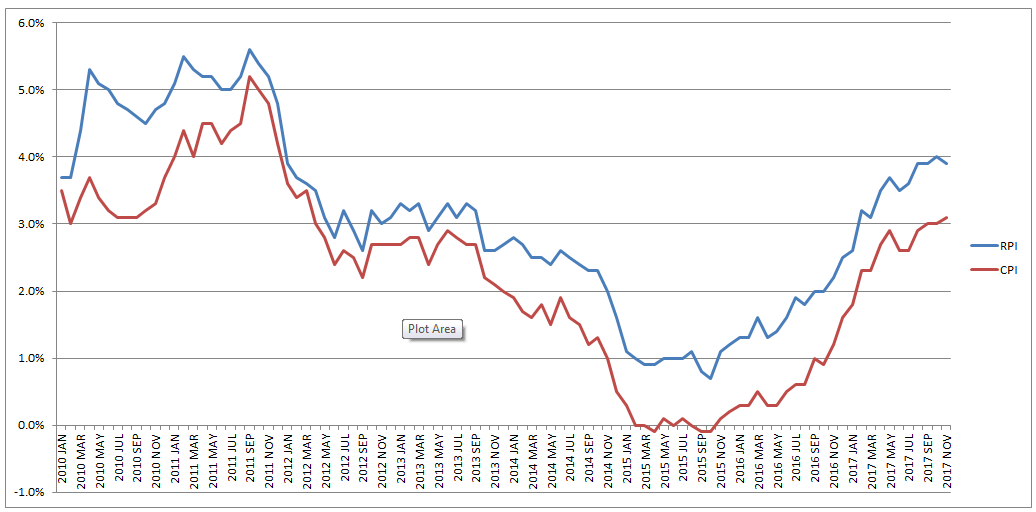
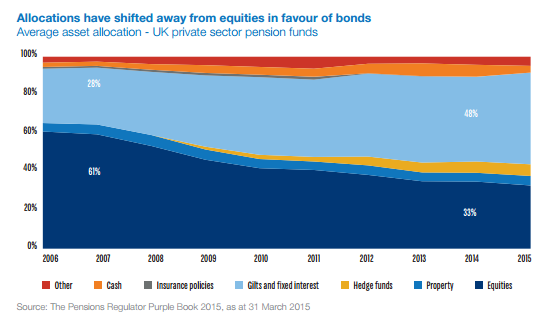
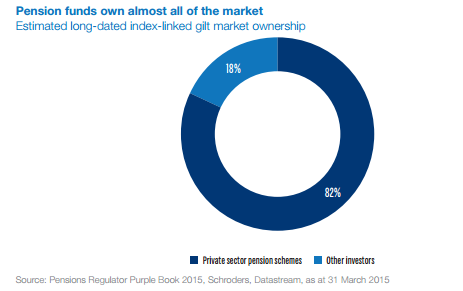
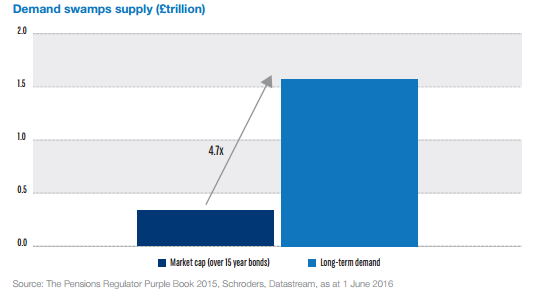
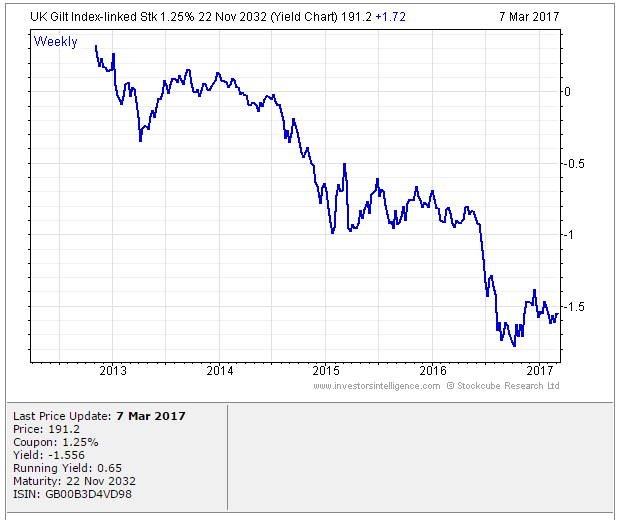
Piketty’s law is still useful, and I do find it convincing to a first order of approximation. But I do think this section of the book could have benefited from more time spent highlighting some of the distortions potentially caused by using net income as our primary measure of income. There are multiple theoretical models used in macroeconomics, and it would have been useful for Piketty to help frame his law within the established paradigm. The great RPI swindle?14/12/2017 Last week it was announced that UK Rail Fares were to increase once again at the maximum allowed rate - 3.4%, corresponding to the RPI increase in July 2017. News article: www.bbc.co.uk/news/business-42234488 When reading this it got me thinking - why is RPI even being used any more? Aren't we supposed to be using CPI now? In 2013 the ONS stated that: "Following a consultation on options for improving the Retail Prices Index (RPI), the National Statistician, Jil Matheson, has concluded that the formula used to produce the RPI does not meet international standards and recommended that a new index be published." So basically the ONS no longer endorses RPI as the best indicator of the level of inflation in the economy. The ONS instead supports the use of CPI. So why does it matter that some organisations are still using RPI? To see why, let's take a look at a chart showing the historic RPI and CPI increases in the UK: Source: www.ons.gov.uk/economy/inflationandpriceindices RPI has been greater than CPI in every single month since 2010. In fact, in this time period, RPI has been an average of 0.8% higher than CPI. This fact might go some way to explain why the Government is so slow to move rail increases from RPI to CPI. This way the Government and Rail Companies can claim that they are only increasing their costs in line with inflation, which seems fair, yet the index they are using is actually higher than the usual inflation index used in the UK. The Government also indexes some of it's outgoings by an inflation index, for example the State Pension, so at least this is also being consistently overstated right? Well actually no! Wherever the government is using an inflation index to increase payments, it seems to have already transitioned to a CPI increase. Let's look at the list of items which use the inflation index which is more beneficial to the Government: (remember that CPI is almost always lower than RPI): There are some pretty hefty items on the list, including, the State Pension, Benefit Payments, Rail Fares, Utility bills, Student Loans. The ones that decrease government spending seem to have already transitioned over, and the ones that increase the amount of tax collected, or the cost of regulated items all seem to still be using the higher RPI index. Now let's look at the list of items which use the inflation index which is to the disadvantage of the Government. The list is certainly a lot shorter, and the items on it are less substantial. Indexed linked Government Bonds are however quite substantial. The reason that the Government is not able to move these to a CPI index is that it would be considered a default to downgrade the index once the bonds have been sold. The Government has no choice but to continue paying the bonds at RPI. Also, the yield on the bonds will be set with an eye towards the yield on a fixed bond, and the expected level of inflation. Therefore the actual index used is not necessarily that important. It's nice to see though that at least stamps are increased at a CPI rate! Source: www.ons.gov.uk/economy/inflationandpriceindices/methodologies/usersandusesofconsumerpriceinflationstatistics What even are Ogden Rates anyway? The Ogden tables are tables of annuity factors, published by the Government's Actuary Department, which are used to calculate court awards for claimants who have had life changing injuries or a fatal accident and are eligible for a payout from their insurance policy. For example, consider a 50 year old, male, primary school teacher who suffers a car accident which means that they will not be able to work for the rest of their life. The Ogden Tables will be used to calculate how much they should be paid now to compensate them for their loss of earnings. Suppose the teacher is earning a salary of £33,000 when they have the accident, then under the Ogden Rates prior to March 2017, the teacher would be paid a lump sum of £33,000* 20.53 = £677,490 where 20.53 is the factor from the tables. How did the Government's Actuary Department come up with these factors? The factors in the table are based on two main pieces of information, how long the person is expected to live, and how much money they can earn from the lump sum once they are given it (called the discount rate). It's this second part which has caused all the problems between the Ministry of Justice and the Insurance Industry. The discount rate should be selected to match the return generated on assets. For example, if the claimant puts all their money in shares then on average, they will generate much more income than if they put the lump sum in a savings account. So what should we assume our school teacher will invest their lump sum in? Since the school teacher will not be able to work again, and therefore will need to live off this money for the rest of their life, they will not want to risk losing all their money by investing in something too risky. In technical terms, we would say that the claimant is a risk adverse investor. In order to mimic the investment style of this risk adverse investor, when the Ogden tables were first set, it was decided to assume that the investor would put all their money in index-linked bonds. There are a couple of reasons to assume this, many risk adverse institutional investors do purchase a lot of index-linked bonds, and also, the average discount rate for these bonds is readily available as it is already published by the UK DMO. At the time the tables were set up, this seemed like a great idea, but recently it has made a lot of people very angry and been widely regarded as a bad move. What are Index-linked bonds again? In the 1981 the UK government started issuing a series of gilts which instead of paying a fixed coupon, paid a floating coupon which was a fixed percentage above the rate of inflation. The UK Debt Management Office is responsible for issuing these bonds, and the following website has details of the bonds that are currently in issue. It's quite interesting to see how it all works: www.dmo.gov.uk/reportView.aspx?rptCode=D1D&rptName=50545854&reportpage=D1D The basic principle is if you purchase a bond that pays 2% coupons, if inflation is 3%, they would pay 3%+2%, if inflation was 5%, then they would pay 5% + 2%. Due to the fact that these bonds always gave a fixed real return (2% in this case), institutional investors really like them. Because there is no inflation risk, on average index-linked bonds cost more than fixed coupon bonds once you account for the effects of inflation. Pension Schemes in particular purchase a lot of these bonds, Why do Pension Schemes like these bonds so much? Most pensions are increased annually in line with inflation, due to this Pension Schemes like to hold assets that also go up in line with inflation every year. In order to get real returns on their investments, Pension Schemes traditionally held a mix of shares and index-linked bonds, the shares gave better returns, but the bonds were more safe. This all started to go very wrong after the financial crisis . A huge drop in interest rates and investment returns, combined with soaring life expectancy lead to more and more pension schemes winding up and the remaining ones have funding issues. As the schemes started winding up they became more and more risk adverse and started to move away from the more volatile assets like shares and moved towards index-linked bonds instead. This table from the PPF's Purple Book shows the move away from shares into bonds. We can see that back in 2006, prior to the financial crisis, Pension Schemes were on average holding around 61% of their assets in equities. When we look again at 2014 this percentage has dropped to 33% and the slack has largely been taken up by bonds. Pension Schemes like these assets so much in fact that Schroders estimated that 80% of the long term index-linked gilts market is held by private sector pension schemes as the following chart shows. Source: www.schroders.co.uk/en/SysGlobalAssets/schroders/sites/ukpensions/pdfs/2016-06-pension-schemes-and-index-linked-gilts.pdf Does it matter that Pension Schemes own such a high proportion of these gilts? The problem with the index-linked gilt market being dominated by Pension Schemes is one of supply and demand. The demand for these bonds from Pension Schemes far outweighs the supply of the bonds. Another chart from Schroder's estimates the demand for the bonds is almost 5 times the supply. Source: www.schroders.co.uk/en/SysGlobalAssets/schroders/sites/ukpensions/pdfs/2016-06-pension-schemes-and-index-linked-gilts.pdf As you might expect with such a disparity between supply and demand, Pension funds have been chasing these assets so much that yields have actually become negative. This means that Pension Schemes on average are paying the government to hold their money for them, as long as it's protected against inflation. Here is a chart showing the yield over the last 5 years for a 1.25% 2032 index-linked gilt. Source: www.fixedincomeinvestor.co.uk/x/bondchart.html?id=3473&stash=F67129F0&groupid=3530 So what does this have to do with Ogden Rates? So now we are in a position to link this back to the recent change in the Ogden Rate. Because the yield on index-linked bonds has traditionally been used as a proxy for a risk-free real return, the yield is still used to decide the discount rate that should be used to calculate court award payouts. Because Pension Schemes have been driving up the price of these bonds so much, we have the bizarre situation that the amount that insurance companies have to pay out to claimants has suddenly jumped up considerably. In the case of a 20 year old female for example, the amount that would be paid out has almost tripled. As these pay outs are already considerable, the financial impact of this change has been massive. So what should the Government do? There is no easy answer, if the Government doesn't use the yield on index-linked gilts to calculate the Ogden rate then there is no obvious alternative. I think the most reasonable alternative would be to use a weighted average of returns on the types of assets that an average claimant would hold. For example, we might assume the claimant is going to hold 50% of their lump sum in cash, 30% in shares, and 20% in bonds, and we would then calculate the weighted return from this portfolio. The issues with doing nothing is that the additional cost from these increased pay outs will inevitably be passed on to the policyholders through higher premiums. So ultimately there is an issue of fairness whereby people who are receiving payouts are being paid a disproportionate amount of money, and this is being subsidised by policyholders other policyholders.
Now that Brexit is looking like a reality, why stop there? Can we say anything sensible about the merits of seeking even further devolution? What about an English exit from the United Kingdom. One (slightly) tongue in cheek article I read even suggested that Londonxit should also be considered given the difference between how people in London voted in the Referendum, and how the rest of the country voted.
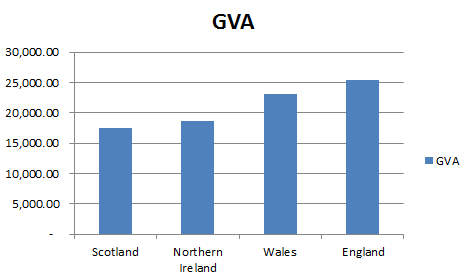
So here is a tongue in cheek analysis of this suggestion. GVA, or Gross Value Added, is a measure of the value of the goods and services added to the economy. The ONS publishes figures for GVA split by region in the UK and the results are interesting:
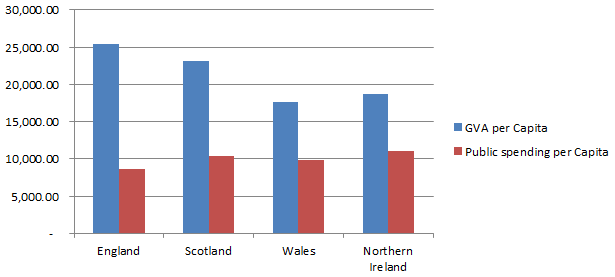
So the first point to note is that the average person in England is contributing more to the economy as measured by GVA than the average person in Wales, Scotland or Northern Ireland, with Scotland being a close second. In graph form the results looks like this: One obvious candidate for why England is more efficient might be that England has higher levels of government investment. The ONS publishes figures on this as well and we can see that in fact the opposite is true:
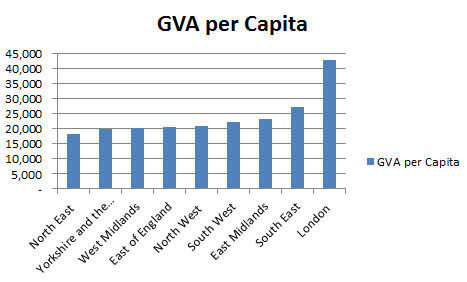
England in fact has the lowest level of public spending. So not only does England have the highest GVA, it is doing so with the lowest public spending per capita! It seems that England is being dragged down with it's fellow UK members. Lets not stop there though,.we can also look at GVA figures on a regional level.
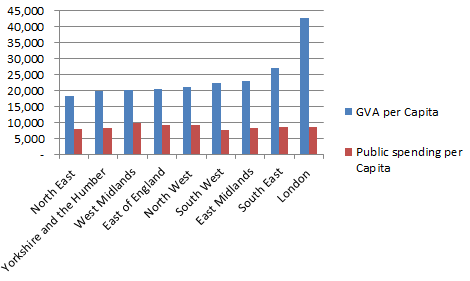
So we see that London is far ahead of the other regions in the UK when measured by GVA. If we once again add in public spending, (which according to the perception created by most media is heavily favoured towards London) we get the following chart: It turns out that public spending is actually pretty level through out England. Therefore on the face of it perhaps it's time for Londonxit after all? |
AuthorI work as an actuary and underwriter at a global reinsurer in London. Categories
All
Archives
April 2024
|


 RSS Feed