|
It's still very early days to understand the true fallout from Russia's invasion of Ukraine, but I thought it would be interesting to tally a few of the estimates for the insured loss we've seen so far, all of the below come from the Insider. Please note, I'm not endorsing any of these estimates, merely collating them for the interested reader! Kiv Perchersk Lavra Monastery, Kyiv. @Andriy155
Aggregating probability forecasts18/3/2022 There's some interesting literature from the world of forecasting and natural sciences on the best way to aggregate predictions from multiple models/sources.
For a well-written, moderately technical introduction, see the following by Jaime Sevilla: forum.effectivealtruism.org/posts/sMjcjnnpoAQCcedL2/when-pooling-forecasts-use-the-geometric-mean-of-odds Jaime’s article suggests a geometric mean of odds as the preferred method of aggregating predictions. I would argue however that when it comes to actuarial pricing, I'm more of a fan of the arithmetic mean, I'll explain why below. Python script - PredictIt API11/3/2022
I wrote a quick Python script to download the latest odds from PredictIt, and then output to an Excel file. I've pasted it below as an extract from a Jupyter notebook:
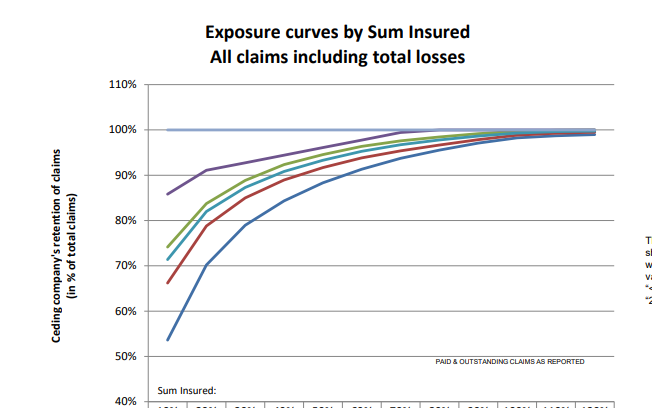
PredictIt is an online prediction website, mainly focused on Political events: www.predictit.org/ I think it's great that PredictIt allow access like this, before I realised the API exists I was using Selenium to scrape the info through Chrome, which was much slower to run, and also occasionally buggy. Cefor Exposure Curves - follow up7/3/2022 The Cefor curves provide quite a lot of ancillary info, interestingly (and hopefully you agree since you're reading this blog), had we not been provided with the 'proportion of all losses which come from total losses', we could have derived it by analysing the difference between the two curves (the partial loss and the all claims curve) Below I demonstrate how to go from the 'partial loss' curve and the share of total claims % to the 'all claims' curve, but you could solve for any one of the three pieces of info given two of them using the formulas below. Source: Niels Johannes https://commons.wikimedia.org/wiki/File:Ocean_Countess_(2012).jpg
Cefor Exposure Curves3/3/2022 I hadn't see this before, but Cefor (the Nordic association of Marine Insurers), publishes Exposure Curves for Ocean Hull risks. Pretty useful if you are looking to price Marine RI. I've included a quick comparison to some London Market curves below and the source links below.
|
AuthorI work as an actuary and underwriter at a global reinsurer in London. Categories
All
Archives
April 2024
|


 RSS Feed