|
Which areas of actuarial work are the best paid? Salary estimates for actuarial work are pretty hard to come by and in my experience not particularly accurate, Also, in practice there are also large differences in salary when accounting for experience, practice area, function, and location. So I thought I'd try to put together my own analysis which accounts for all these variables! As a source of data I decided to work from online Job Adverts, mainly because I can collect them with a minimum of effort, but also because the only other option would be to send out my own survey (and to be honest why would anyone complete a salary survey from a random guy online?). Step 1. Collect Some Data I started by web scraping about 800 job adverts from an actuarial job site. This was all the job which were listed on the website at the time. Since this might be 'slightly' (i.e. completely) against the terms of service of the site, I won't say which site the adverts are from or publish any of the raw data. I don't see any issues with publishing aggregated data from the website though. Once I had scraped the adverts, I extracted the salary figures and discarded adverts that did not include a salary, this left about 350 job advert to work with. Step 2. Analysis My first step was to segment the adverts by practice area. Rather than going through each advert one at a time, I split them by looking at key words in the adverts, for example, adverts containing the terms 'pensions', 'employee benefits', or 'defined contribution' were all assigned to the category 'Pensions'. These figures were then used to produce the following box and whiskers chart: 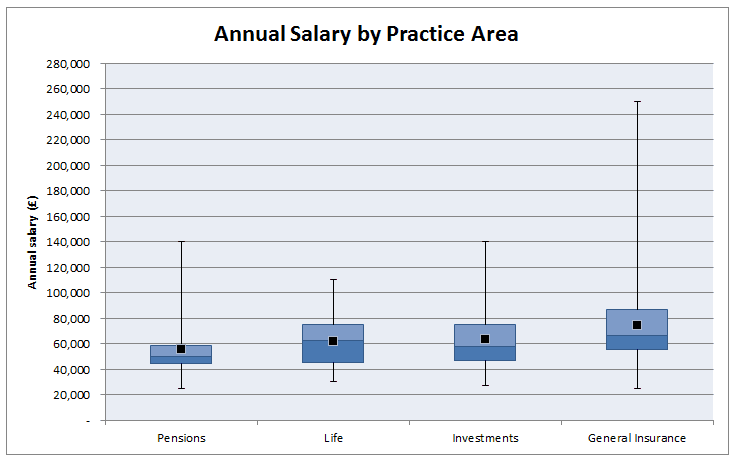 As expected, General Insurance comes out as the highest paid practice area with Life and Investments in joint second place and Pensions lagging quite a bit behind. In case you can't remember how a box and whiskers chart works, the black dot is the mean, the three lines in the box represent the 1st quartile, median, and 3rd quartile, and the whiskers go up to the maximum and down to the minimum value. Are there any other correlations that are affecting this ranking though? Since a lot of GI jobs are based in London, does London's higher average salary accounts for the difference? First let's check that actuarial jobs in London do actually have higher salaries than actuarial jobs outside London. 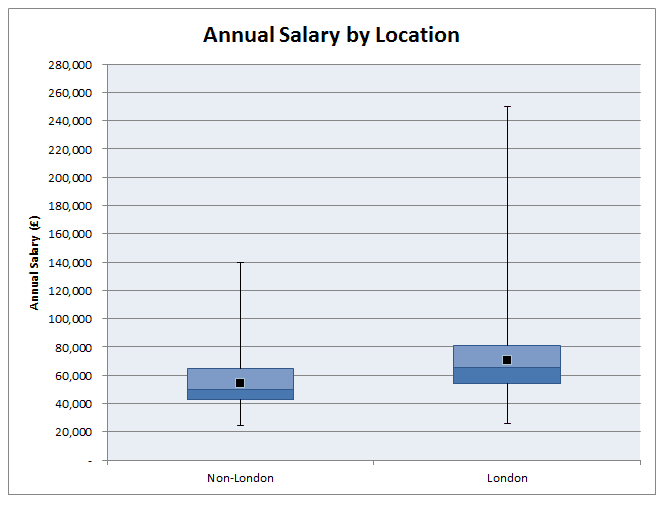 As expected, London based jobs are clearly better paid on average than non-London based jobs. In order to see whether location is driving the differences between salaries across practice areas we need to include location as another variable in our chart: 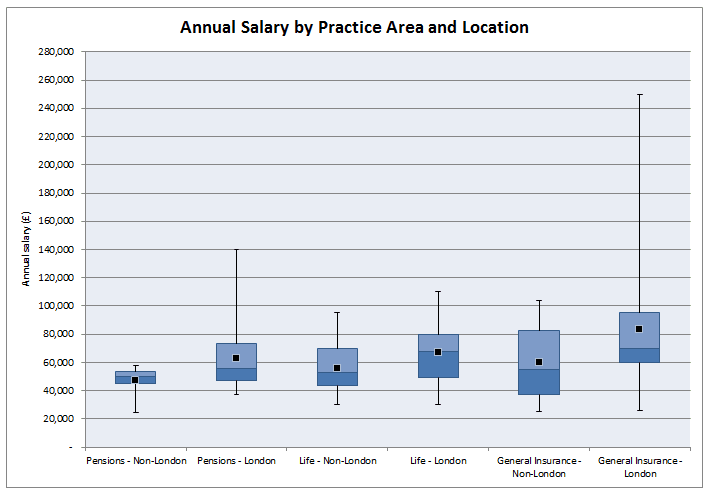 This chart gets a bit more messy, but we can see that even when we account for the effect of location, we still have the same ordering of practice area: General Insurance > Life > Pensions Now that we've looked at practice areas, I'm going to show my bias towards insurance and look at the effect of the type of actuarial work within an insurance company on salary. 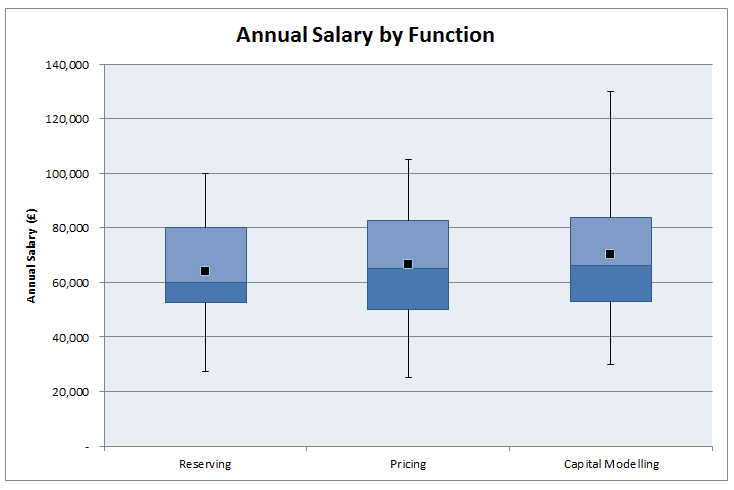 Surprisingly, all the functions are relatively equal. There seems to be a weak ordering of: Capital Modelling > Pricing > Reserving Though the difference does not seem to be significant. 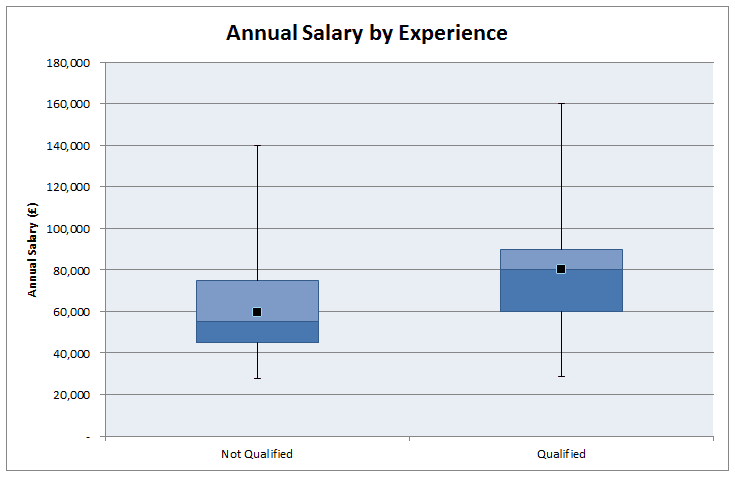 Finally, let's look at the effect of qualifying on salary. As expected, jobs for qualified actuaries have a mean of £20,000 higher than part/nearly qualified positions. All the more reason I should be studying right now rather than procrastinating on here!. Actuarial Science vs Mathematics24/12/2016 Let's suppose you've decided that ultimately an actuarial career is the career for you. You've heard that it's well paid, low stress, and offers a great work-life balance. If this is the case, you'd be crazy to study anything but Actuarial Science at University right? Well kind of... Naturally, no discussion of whether to study Maths, Actuarial Science, or Finance would be complete without one of my favourite charts (for some reason I really like the name), a Gantt Chart, so here is one showing an example of how long it might take a student to qualify if they studied Actuarial Science or Mathematics. 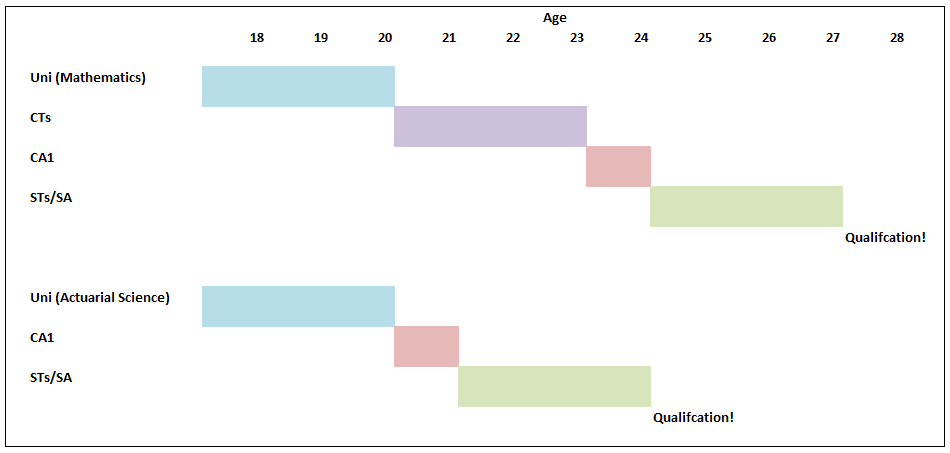 Exemptions! Why is the actuarial science path so much shorter? Most 3 year actuarial science courses will give you the opportunity to gain exemptions from the first 8 CTs. It's the reason that in the chart above actuarial science is so much quicker to qualify, and it's one of the main reasons that people decide to study actuarial science at uni. So are there any downsides to getting all these exemptions? Oh, you just got exemptions? I did it the hard way... Qualifying through exemptions is definitely quicker than qualifying through the institute exams so expect some sour grapes from people who did it 'the hard way'. There is also a perception that an equivalent exam at uni is easier than an IFoA exam. It's hard to judge this, but I have memories of doing very little work for some uni modules during most of the year, then cramming for a couple of days before the exam and then scraping a pass. Good luck doing this with the institute exams! So expect in your career for someone who studied the institute exams to be seen as marginally more accomplished than someone who passed through university exemptions. Is it better to keep your options open? Actuarial Science is also a much more focused degree, it literally has the job title in the subject. On the whole, Mathematics gives a much broader range of possible career paths than Actuarial Science. People who study actuarial science, though not completely locked in to becoming an actuary, are pretty much restricted to a career in finance. Maths grads have a much broader range of careers but can also easily move into finance. So I think that there is an argument for keeping your options open a bit more with a broader degree. Imagine you start Actuarial Science at 18 and then decide that you hate finance? Also, you need to ask yourself what you want to get out of your university education. There are two main schools of thought as to the purpose of a university education . The liberal arts school of thought, more prevalent in US universities, has students studying a wide range of topics with the goal of producing a well rounded graduate, able to step up and fully participate in civic life. The European model places more emphasis on vocational study, with a university degree being seen as preparation for a career. Actuarial Science is definitely on the vocational side of the spectrum, whereas I would say that Mathematics is more on the liberal arts side of the spectrum. (This might sound questionable, how can a Mathematics degree be considered a Liberal Art? But remember that the goal of most mathematics degrees is to teach you to think 'like a mathematician' it's widely acknowledge that you will never use 99% of the actual mathematics that you studied) That's also not to say that actuarial science degrees will focus only on 'actuarial' topics, most will cover the full range of finance, business and economics and in some respects are broader than a mathematics education. But for me it's the fact that you are studying as preparation for a specific job rather than studying general skills that makes actuarial science more vocational. It's not what you know it's who you know... I think one strong point in favour of actuarial science which I haven't seen discussed much is that actuarial science grads seem to make much better connections and have more recruitment opportunities than less vocational degrees. Most of my friends who studied mathematics are spread through various industries and various countries. Whereas most connections made through an actuarial science degree will end up working in the same industry as you, focused around the same few cities. If nothing else it gives you more people to meet for drinks at lunch under the guise of 'networking'. Some more random thoughts.
Solving a Snake Cube Puzzle19/12/2016
My colleague at work gave me a snake cube puzzle to try to solve, and if you haven't tried, they are a lot harder to solve than they look.
After trying and failing for about 10 minutes to solve the puzzle, I had a great idea, why not waste a couple of hours writing a program to solve it for me? And then a couple of hours turned into a couple more hours, but I got there in the end! The aim is to wrap the snake into a 3x3x3 cube. Here is what the snake puzzle looks like when it is unwrapped. 
How does the Program work? There are two main approaches to solving the puzzle programmatically, you could either systematically enumerate all permutations of the snake, or randomly try different permutations until you find one that works. I went with the second option. which seemed like it would probably be computationally slower, but easier to program. I decided to write the code in Python, it works by randomly twisting the snake one joint at a time, and restarting everytime the snake either crosses itself or goes outside a 3x3x3 grid. The code runs 100,000 simulations in approximately 20 seconds on my laptop, which turns out to be just about fast enough to get an answer when you leave the program to run for a couple of hours. The code:
from random import randint
import time

def f(x):
    return {
        1: 1,
        2: 2,
        11: 0,
        12: 2,
        21: 0,
        22: 1,
    }[x]

def drandomu():
    drandomint = randint(1, 2)
    if drandomint == 1:
        drandomint = -1
    else:
        drandomint = 1
    return drandomint

def drandom(iDirection):
    drandomint1 = f(iDirection * 10 + randint(1, 2))
    return drandomint1

CurrentTime = time.clock()
vArray = [[[0 for x1 in range(3)] for y1 in range(3)] for z1 in range(3)]
vMaxArray = [[[0 for x2 in range(3)] for y2 in range(3)] for z2 in range(3)]


iMax = 0
iTotalBlock = 1
vChain = [3, 1, 1, 2, 1, 2, 1, 1, 2, 2, 1, 1, 1, 2, 2, 2, 2]
m = 1000000
limit = int(m * 1)
for lSim in range(limit):
    try:
        GiveUp = "False"
        iDirection = 0
        iTotalBlock = 1
        vCurrent = [0, 0, 0]
        for x in range(3):
            for y in range(3):
                for z in range(3):
                    vArray[x][y][z] = 0
        for iLink in range(17):
            if GiveUp == "False":
                if iLink == 0:
                    for iBlock in range(vChain[iLink]):
                        if iBlock > 0:
                            vCurrent[0] += 1
                        vArray[vCurrent[0]][vCurrent[1]][vCurrent[2]] = iTotalBlock
                        iTotalBlock += 1
                else:
                    iDirection = drandom(iDirection)
                    iUpOrDown = drandomu()
                    for iBlock in range(vChain[iLink]):
                        if vCurrent[iDirection] == 0:
                            iUpOrDown = 1
                        vCurrent[iDirection] += iUpOrDown
                        if vArray[vCurrent[0]][vCurrent[1]][vCurrent[2]] != 0:
                            if iMax < iTotalBlock:
                                iMax = iTotalBlock
                                for x in range(3):
                                    for y in range(3):
                                        for z in range(3):
                                            vMaxArray[x][y][z] = vArray[x][y][z]
                            GiveUp = "True1"
                            break
                        else:
                            vArray[vCurrent[0]][vCurrent[1]][vCurrent[2]] = iTotalBlock
                            iTotalBlock += 1

        iTotalBlock = 0
        for x in range(3):
            for y in range(3):
                for z in range(3):
                    iTotalBlock += vArray[x][y][z]

        if iTotalBlock == 378:
            print(vArray)
    except:
        pass

print(int(time.clock() - CurrentTime), "Seconds")
print(int((time.clock() - CurrentTime)/60), "Minutes")

for x in range(3):
    print(vMaxArray[x])

print(iMax)
The Solution The program eventually gave me the following layout as a solution: [[1, 16, 23], [18, 17, 22], [19, 20, 21]] [[2, 15, 24], [5, 6, 7], [10, 9, 8]] [[3, 14, 25], [4, 13, 26], [11, 12, 27]] The easiest way to think about the solution the program gives is to think of the three blocks of three digits on the left as the bottom layer, the second block of three digits as the second layer, and then the third block of three as the third layer. So the 4th block is directly abov the third block. Here is the completed puzzle: 
|
AuthorI work as an actuary and underwriter at a global reinsurer in London. Categories
All
Archives
April 2024
|
 RSS Feed