How do Bookmakers make money?23/12/2017 "The safest way to double you money is to fold it in half" Kin Hubbard "I like to play Blackjack. I'm not addicted to gambling. I'm addicted to sitting in a semi-circle." Mitch Hedberg Gambling is a risky business, in the long run everyone loses. Well not everyone. Bookmakers always seem to do alright. How is it that bookmakers make so much money out of gambling then? Is it through their superior wit and street smarts, or is there something else going on? It turns out that the method used by bookmakers involves a lot less insight and risk than you might think. The process is mathematical, and is guaranteed to turn a profit, and actually quite interesting. Making a Dutch Book Let's start with an example, suppose I am a bookmaker offering odds on the Super Bowl coin toss. We all know that for a fair coin, the probability of getting a heads is 50%, and the probability of getting tails is 50%. We might suppose therefore that we would set our odds at 1/1, meaning for a bet of £1 if you win, you get £1 back plus your original £1. This means that you would double your money if you win (which happens about half the time) and lose all your money if you lose (which happens about half the time). Over time, if you made lots of bets of £1 at these odds, you would expect to break even. Let's suppose though, that for reasons unknown to us, far more money is being bet on heads than tails. For example, suppose £1,000 is put on heads, and only £500 is put on tails. We can then examine our position under two scenarios, one where heads wins, and one where tails wins. 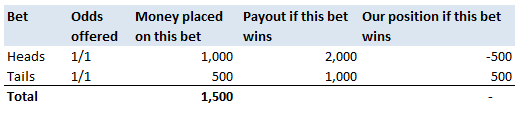 We have taken in £1,500 in total, and our outgoings are either £2,000 or £1,000. Making us a profit of £500 half the time, and -£500 half the time. Given each outcome is equally likely, over the long run if we keep offering odds like these we will expect to break even. We can do better than this though. We can actually set the odds so that we break even every single time, not just in the long run. In order to see this, let's suppose that we change the odds so that they are 1/2 for heads, and 2/1 for tails. So that means, for every £2 bet on heads, we will pay out £1, plus the original £2 bet, and for every £1 bet on tails, we will pay out £2, plus the original £1 bet. Under these new odds, we would then end up with the following position: 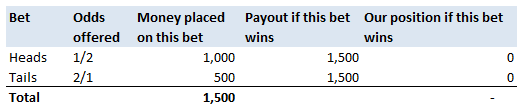 We see now that because of how we have amended the odds, we don't actually care who wins. We will always pay out the same amount. The Bookmaker can then adjust the odds slightly, so that they will always pays out less than they have taken in. For example, they might offer 5/11 for heads, and 9/5 for tails. Under these odds, not only will the Bookmaker not care who wins, but they will always make a small margin on all bets placed. The exact figures in this case would be: 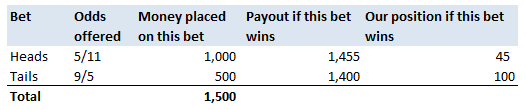 So we see that the Bookmaker has a foolproof system of always making money from gambling, and plus, they don't even need to be good at predicting who will win. Irrational odds? Isn't it crazy to offer odds of 2/1 on a coin toss though? We all know that the actual odds for a fair coin should be 1/1! The answer is that as soon as people see these odds, they should start betting on tails, and by supply and demand the odds for tails will start to move down, and the odds for heads will start to move up. The bookmaker themselves might also decide to take a position at these odds and effectively bet money themselves by allowing the payout to be skewed towards a 50/50 split, giving their payout a positive Expected Value. The first time I read about this system of bookmaking was in the book "Financial Calculus: an introduction to derivative pricing" by Baxter and Rennie, which I was reading in preparation for the IFoA ST6 exam. Baxter and Rennie brought it up because Bookmakers are actually undertaking a form of arbitrage, similar to the series of notional trades used when deriving the price of futures contracts. You can see the similarities by simply noting that both the bookmaker and the derivatives trader are acting so as to not have any exposure to the actual value of the underlying event. By doing this, they don't actually need to take a view at all on what the expected outcome is, but they can instead exploit the relative values of different parts of the market. What margin to online bookmakers charge? I had a quick look at some odds offered by online bookmakers on a couple of events. One of the events I looked at was UFC 218. BestFightOdds.com gives a comparison of the odds offered by various betting websites. This is mainly to help people pick which website to bet on in order to get the best odds, but we can use it to compare the margins that the different websites charge. Assuming an equal bet is placed on each fight on the card, I calculated the following margins for the websites listed by BestFightOdds:  They range from a low of 2.62%, up to about 6%. The individual margin on each fight varies quite a bit, and also I suspect each website will run different margins on different sports and different events. The reason for this is that some of the higher margin websites might offer more incentives, and more free bets than the lower margin websites., plus they might be more established and spend more on advertising allowing them to charge more and still retain sufficient numbers of customers. The fact that websites run margins does mean that if you are going to make money gambling you need to first beat the margin before you can even break even. Let's say you're really good at gambling and you can out-predict the market by 2%, you would still lose money overall gambling on any of these websites, because you also need to factor in the margin (also called the vig) that the websites charge. Sources: (1) BestfightOdds.com: www.bestfightodds.com/events/ufc-218-holloway-vs-aldo-2-1368 The great RPI swindle?14/12/2017 Last week it was announced that UK Rail Fares were to increase once again at the maximum allowed rate - 3.4%, corresponding to the RPI increase in July 2017. News article: www.bbc.co.uk/news/business-42234488 When reading this it got me thinking - why is RPI even being used any more? Aren't we supposed to be using CPI now? In 2013 the ONS stated that: "Following a consultation on options for improving the Retail Prices Index (RPI), the National Statistician, Jil Matheson, has concluded that the formula used to produce the RPI does not meet international standards and recommended that a new index be published." So basically the ONS no longer endorses RPI as the best indicator of the level of inflation in the economy. The ONS instead supports the use of CPI. So why does it matter that some organisations are still using RPI? To see why, let's take a look at a chart showing the historic RPI and CPI increases in the UK: 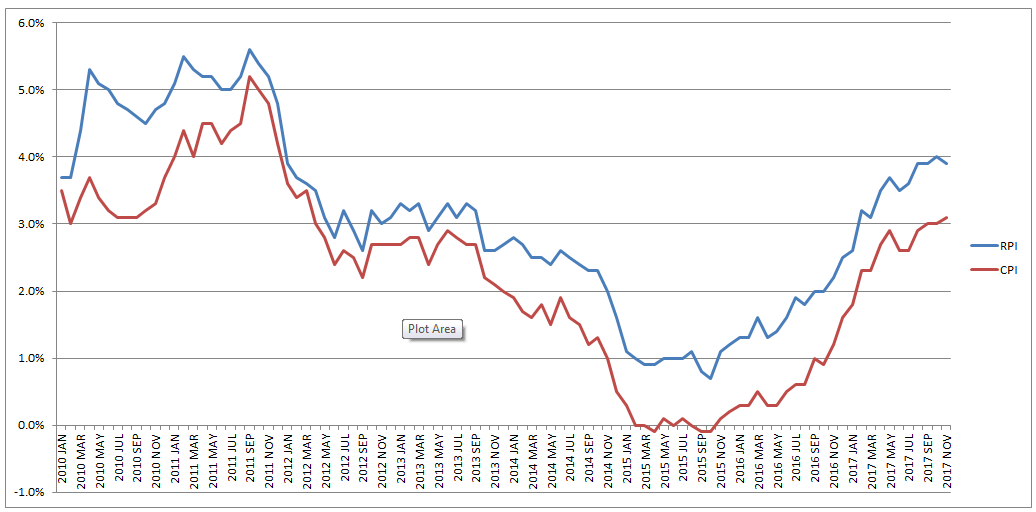 Source: www.ons.gov.uk/economy/inflationandpriceindices RPI has been greater than CPI in every single month since 2010. In fact, in this time period, RPI has been an average of 0.8% higher than CPI. This fact might go some way to explain why the Government is so slow to move rail increases from RPI to CPI. This way the Government and Rail Companies can claim that they are only increasing their costs in line with inflation, which seems fair, yet the index they are using is actually higher than the usual inflation index used in the UK. The Government also indexes some of it's outgoings by an inflation index, for example the State Pension, so at least this is also being consistently overstated right? Well actually no! Wherever the government is using an inflation index to increase payments, it seems to have already transitioned to a CPI increase. Let's look at the list of items which use the inflation index which is more beneficial to the Government: (remember that CPI is almost always lower than RPI): 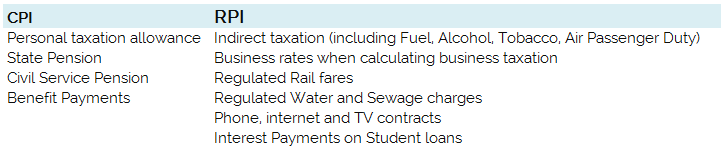 There are some pretty hefty items on the list, including, the State Pension, Benefit Payments, Rail Fares, Utility bills, Student Loans. The ones that decrease government spending seem to have already transitioned over, and the ones that increase the amount of tax collected, or the cost of regulated items all seem to still be using the higher RPI index. Now let's look at the list of items which use the inflation index which is to the disadvantage of the Government. 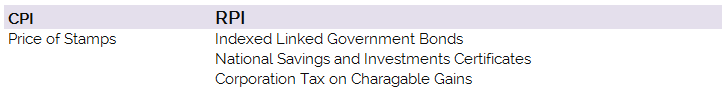 The list is certainly a lot shorter, and the items on it are less substantial. Indexed linked Government Bonds are however quite substantial. The reason that the Government is not able to move these to a CPI index is that it would be considered a default to downgrade the index once the bonds have been sold. The Government has no choice but to continue paying the bonds at RPI. Also, the yield on the bonds will be set with an eye towards the yield on a fixed bond, and the expected level of inflation. Therefore the actual index used is not necessarily that important. It's nice to see though that at least stamps are increased at a CPI rate! Source: www.ons.gov.uk/economy/inflationandpriceindices/methodologies/usersandusesofconsumerpriceinflationstatistics Compound Poisson Loss Model in VBA13/12/2017 I was attempting to set up a Loss Model in VBA at work yesterday. The model was a Compound-Poisson Frequency-Severity model, where the number of events is simulated from a Poisson distribution, and the Severity of events is simulated from a Severity curve. There are a couple of issues you naturally come across when writing this kind of model in VBA. Firstly, the inbuilt array methods are pretty useless, in particular dynamically resizing an array is not easy, and therefore when initialising each array it's easier to come up with an upper bound on the size of the array at the beginning of the program and then not have to amend the array size later on. Secondly, Excel has quite a low memory limit compared to the total available memory. This is made worse by the fact that we are still using 32-bit Office on most of our computers (for compatibility reasons) which has even lower limits. This memory limit is the reason we've all seen the annoying 'Out of Memory' error, forcing you to close Excel completely and reopen it in order to run a macro. The output of the VBA model was going to be a YLT (Yearly Loss Table), which could then easily be pasted into another model. Here is an example of a YLT with some made up numbers to give you an idea: 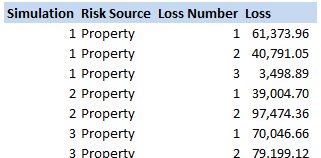
It is much quicker in VBA to create the entire YLT in VBA and then paste it to Excel at the end, rather than pasting one row at a time to Excel. Especially since we would normally run between 10,000 and 50,000 simulations when carrying out a Monte Carlo Simulation. We therefore need to create and store an array when running the program with enough rows for the total number of losses across all simulations, but we won't know how many losses we will have until we actually simulate them. And this is where we come across our main problem. We need to come up with an upper bound for the size of this array due to the issues with dynamically resizing arrays, but since this is going to be a massive array, we want the upper bound to be as small as possible so as to reduce the chance of a memory overflow error. Upper Bound What we need then is an upper bound on the total number of losses across all the simulations years. Let us denote our Frequency Distribution by $N_i$, and the number of Simulations by $n$. We know that $N_i$ ~ $ Poi( \lambda ) \: \forall i$. Lets denote the total size of the YLT array by $T$. We know that $T$ is going to be: $$T = \sum_{1}^{n} N_i$$ We now use the result that the sum of two independent Poisson distributions is also a Poisson distribution with parameter equal to the sum of the two parameters. That is, if $X$ ~ $Poi( \lambda)$ , and $Y$ ~ $Poi( \mu)$, then $X + Y$ ~ $Poi( \lambda + \mu)$. By induction this result can then be extended to any finite sum of independent Poisson Distributions. Allowing us to rewrite $T$ as: $$ T \sim Poi( n \lambda ) $$ We now use another result, a Poisson Distribution approaches a Normally Distribution as $ \lambda \to \infty $. In this case, $ n \lambda $ is certainly large, as $n$ is going to be set to be at least $10,000$. We can therefore say that: $$ T \sim N ( n \lambda , n \lambda ) $$ Remember that $T$ is the distribution of the total number of losses in the YLT, and that we are interested in coming up with an upper bound for $T$. Let's say we are willing to accept a probabilistic upper bound. If our upper bound works 1 in 1,000,000 times, then we are happy to base our program on it. If this were the case, even if we had a team of 20 people, running the program 10 times a day each, the probability of the program failing even once in an entire year is only 4%. I then calculated the $Z$ values for a range of probabilities, where $Z$ is the unit Normal Distribution, in particular, I included the 1 in 1,000,000 Z value. 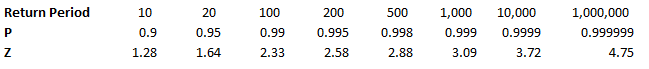
We then need to convert our requirement on $T$ to an equivalent requirement on $Z$. $$ P ( T \leq x ) = p $$ If we now adjust $T$ so that it can be replaced with a standard Normal Distribution, we get: $$P \left( \frac {T - n \lambda} { \sqrt{ n \lambda } } \leq \frac {x - n \lambda} { \sqrt{ n \lambda } } \right) = p $$
Now replacing the left hand side with $Z$ gives:
$$P \left( Z \leq \frac {x - n \lambda} { \sqrt{ n \lambda } } \right) = p $$
Hence, our upper bound is given by:
$$T \lessapprox Z \sqrt{n \lambda} + n \lambda $$
Dividing through by $n \lambda $ converts this to an upper bound on the factor above the mean of the distribution. Giving us the following:
$$ T \lessapprox Z \frac {1} { \sqrt{n \lambda}} + 1 $$
We can see that given $n \lambda$ is expected to be very large and the $Z$ values relatively modest, this bound is actually very tight.
For example, if we assume that $n = 50,000$, and $\lambda = 3$, then we have the following bounds: 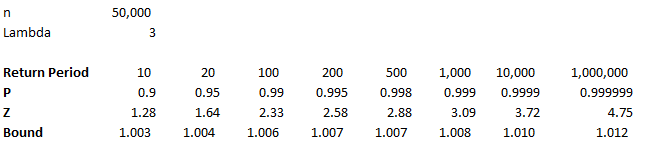
So we see that even at the 1 in 1,000,000 level, we only need to set the YLT array size to be 1.2% above the mean in order to not have any overflow errors on our array. References (1) Proof that the sum of two independent Poisson Distributions is another Poisson Distribution math.stackexchange.com/questions/221078/poisson-distribution-of-sum-of-two-random-independent-variables-x-y
(2) Normal Approximation to the Poisson Distribution.
stats.stackexchange.com/questions/83283/normal-approximation-to-the-poisson-distribution Combining two Rate Change Indices12/12/2017 I came across this problem at work last week, and I don't think there's anything in the notes on how to deal with it, so I have written up an explanation of how I solved it. Suppose we are carrying out a rating exercise on a number of lines of business. For two of the lines of business, Marine Hull and Marine Cargo, we have very few claims so we have decided to group these two lines together for the purpose of the Experience Rating exercise. We have been supplied with separate rate change indices for all the lines of business. How do we combine the Hull and Cargo Rate Change indices? Firstly, let's review a few basics: What is a rate change? It is a measure of the change in price of insurance from one year to the next when all else is constant. Why do we need a rate change? We will often use historic premium as an exposure measure when experience rating a book of business. If we do not adjust for the change in price of insurance then we may under or over estimate the rate of historic losses. What do we mean when we say the rate change 'for 2018'? This answer is debatable, and if there is any uncertainty it is always better to check with whoever compiled the data, but generally the '2018' rate change means the 2017 - 2018 rate change. How do we combine the rate changes from two lines of business? Let's work though an example to show how to do this. I am going to be using some data I made up. These figures were generated using the random number generator in excel, please don't use them for any actual work! Suppose we are given the following Premium estimates: 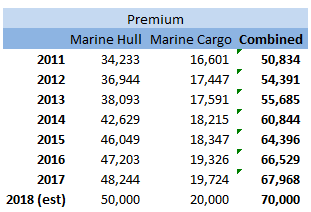 And that we are also given the following rate changes: 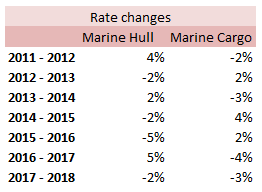 Then first we need to adjust the rate changes so that they are in an index. We do this by setting 2018 to be equal to 100%, and then recursively calculating the previous years using: $${Index}_n = {Index}_{n-1} (1 - {(Rate \: Change )}_{n-1} ) $$ 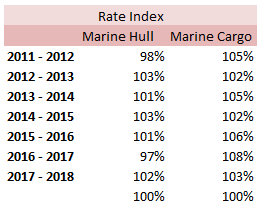 We can then calculate our On-Levelled Premiums, by simply multiplying our Premium figures by the Rate Change Index. $${ ( On \: Levelled \: Premium ) }_n = ({Premium}_n) \: ({Index}_n) $$ 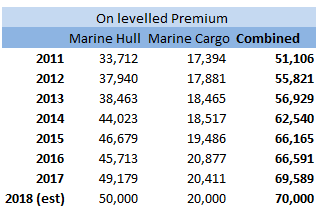 Using the combined on-levelled premiums, we can then calculate our combined Rate Index using the following formula: $${Index}_n = \frac{ { ( On \: Levelled \: Premium ) }_n } { {Premium}_n } $$ And our combined Rate Change using the following formula: $${Rate Change}_{n-1} = \frac{ {Index}_n } { {Index}_{n-1}} -1 $$ 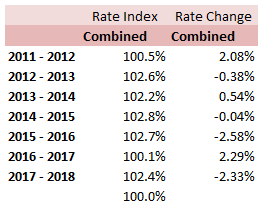 Most of the time we will only be interested in the combined On-Levelled Premium. The combined Rate Change is only a means to an end to obtain the combined On-Levelled Premium. If we have a model though where we need to input a combined Rate Change in order to group the two classes of business, then the method above can be used to obtain the required Rate Changes. |
AuthorI work as an actuary and underwriter at a global reinsurer in London. Categories
All
Archives
April 2024
|
 RSS Feed