|
There was an interesting article in the Economist last week (July 23rd edition) about the growing dependency ratio in the developed world and whether this is sustainable. (the dependency ratio is the ratio of the number of working aged people to number of non-working age people).
It was definitely an interesting read, and I will post a link below, it raises interesting questions about the transfer of wealth from one generation to the next and the fairness of this transfer in a system where there are fewer working age people paying in. One thing about the article that struck me though was that the UN Population Division publishes estimates of the working age population all the way out to 2100! I can't even predict what I will have for lunch tomorrow. Is this a case of the UN being wildly optimistic about their modelling skills? Or perhaps over such a large data sample (the entire human population) the law of large numbers prevails and we can pick out some clear trends which we expect to continue in the future. Let's try to look into how good these population models are. My first step was to try to find estimates of population growth published by the UN Population Division in the past and see how accurate they had been. Every couple of years the UN Population Division publishes a report on World Population Prospects, I managed to find report going back to 2000, link below for the 2000 addition: Previous Estimates I found as many of these reports as I could and chucked the data into a table. Luckily the reports are fairly standardised and it is possible to look at the sequence of estimates. 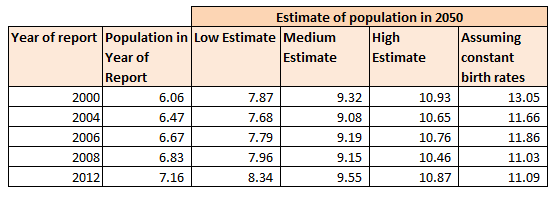
We see that the best estimate of the World Population in 2050 has actually been relatively stable since the year 2000. The standard deviation of the medium estimate is only in the range of 200m, which to me seems like a reasonable volatility for such a far reaching statistic.
An interesting aspect of this data is the drop in the last column between 2000 and 2004. The final column represents the estimate of the population in 2050 assuming that birth rates do not decline. Since we do not have a large shift in the medium estimate between these two dates, this drop in birth rates must have been factored in for the 2000 analysis. So to answer the original question - how accurate can we be about Population Growth - so far pretty accurate. If the UN is able to accurately model the change in birth rates, then perhaps there is hope that they will be able to model population as a whole accurately.
Link to the original article from the economist:
Monte Carlo Tic Tac Toe Engine24/7/2016
Since setting up the approximation of $\pi$ using the Monte Carlo technique of sampling inside a circle, I've been playing around with applying Monte Carlo methods to other problems.
One problem I thought it would be fun to play around with was creating an AI engine that uses Monte Carlo rather than deterministic methods to run. My first thought was to look at a chess engine, I've always wanted to set one up, but after playing around with it for a while I realised setting up the actual game engine was going to be a substantial amount of work before even thinking about the AI. Therefore I shelved that for the time being. The next game I decided to look at Tic-Tac-Toe or Noughts and Crosses which is on the opposite end of the spectrum in terms of complexity of rules. Optimal Strategies As every school age kid quickly learns, there is an optimal strategy for playing Tic-Tac-Toe. In case anyone has forgotten it can easily found online, however programming in the strategy would have been quite tedious, and not as fun as messing around with a stochastic solution. I thought it was interesting that a Monte Carlo engine, if it can be programmed to play the game well without even being told what the optimal strategy is, should replicate this strategy simply by selecting what it believes is the optimal move based on its own analysis. It can do all of this without ever truly knowing what the strategy is. I decided to write the engine in VBA, which is not a great development language generally. But meant that I could stick the game into a Spreadsheet which seemed like a fun thing to do. Here's a screenshot of the game: 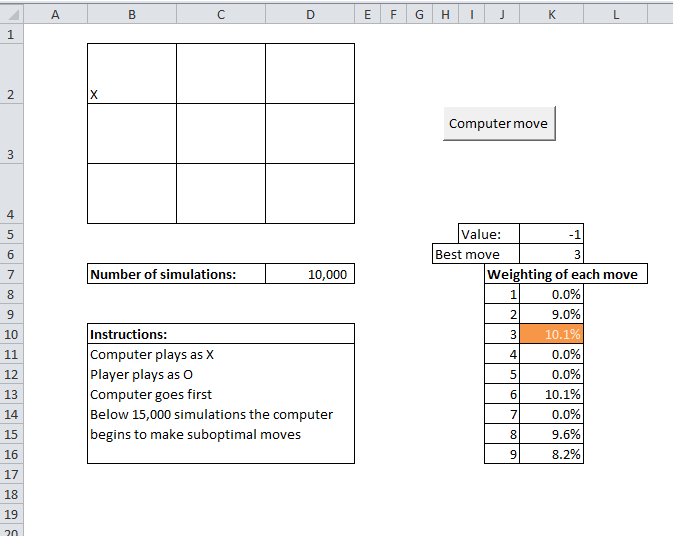
How it works The way the engine works is each time the computer is about to move, it uses the current state of the grid, and plays out a large number of random games (for each move it makes a random selection for itself and then a random selection for the player until one side wins or it is a draw). The computer tracks who wins each game and more importantly, for each of the possible next moves for the computer, whether it eventually ends in a win, draw or loss. The computer repeats this process a large number of times (the default being 10,000), each time assigning a value to the starting move of +1 if the computer eventually wins the game, +0.5 if the game ends in a draw, and 0 if the computer losses the game. The computer keeps a running total of the value assigned to each starting move. Once the simulation of random games is completed, the computer selects the move with the highest value, this should correspond to the starting move that is the most likely to led to a victory or a draw, I've linked below to the Excel file with the game inside:
And here is the source code in VBA:
Future Development Something that I would like to explore in the future is the use of more efficient algorithms for analysing the best move. For example, apparently alpha-beta pruning can be used to focus on the moves that look the most promising rather than spending an equal amount of time looking at all moves. I would also like to make a web based version of the game at some point., Using Monte Carlo Methods to estimate Pi13/7/2016 Monte Carlo Methods Monte Carlo methods, named after the area in Monaco famous for it casinos, are a collection of mathematical methods that use repeatedly sampling of random numbers to solve mathematical problems. They are commonly used to simplify problems that would otherwise be impossible or too time consuming to solve if we were forced to use analytical methods. An example Suppose we are given the option of playing the following game in a casino: The game costs £5 per play. The game involves you rolling 10 dice. If the sum of the dice is greater than 45, you win £10, otherwise you don't win anything. Should you play this game? Off the top of my head, I've got no idea whether this is good value or not. Given we are in a casino, I'm going to guess we would lose money over the long run, but what if we wanted to know for sure? We could work out the answer analytically, we could say things like the probability of rolling a 45 using 7 dice is impossible, but using 8 dice it is.... then work recursively from there and it would take a long time and would be quite tedious. An alternative approach would be to set up a model that would simulate the playing of this game, run the model a few thousand times (which should take seconds) and then see what the long term position is when we average across all the games. Much more interesting. I quickly set up a test of the game, and it turns out it is very bad value. On average we would expect to lose about £4.60 every time we play! The interesting point though is that it took me a couple of minutes to work this out, compared to the hours it would have taken me to calculate it analytically. Monte Carlo Methods in insurance Monte Carlo methods are also commonly used in insurance. For example, in reinsurance pricing, when attempting to find an expected value for a loss to an excess of loss layer we may have a good idea of the size and frequency of the ground up losses, say we know that the frequency of losses is distributed according to a Poisson distribution with a known parameter, and the severity of the losses is distributed according to a Log-normal distribution with known parameters. What can we say about the loss to the layer however? It may be theoretically possible to derive this analytically in some cases, but generally this will be too time consuming and may not even be possible. A Monte Carlo approach, like the dice game earlier, involves repeatedly playing the game, we imagine that we write the contract and we then sample values from the frequency and severity distributions to generate sample loss amounts, we can then apply all the contract details to these generated loss amounts. This process of sampling is repeated tens of thousands of times and by averaging across all our simulations we can derive estimates of the expected loss to the layer or any other piece of information we may be interested in. Other uses of Monte Carlo Methods We can also use Monte Carlo methods in other situations where we wish to estimate a value where analytical methods may fall short.
One example of this is in calculating the value of $\pi$. We use the fact that the area of a unit circle is $\pi$. If we imagine the unit circle sitting inside a unit square, then the area of the unit square is 4, and the ratio of the area inside the circle to the area inside the square is $\pi : 4$. Here is some Octave code to generate a picture:
hold on x = -1:0.001:1; y = (1 - x.^2).^0.5; plot(x,y,'linewidth',2); plot(x,-y,'linewidth',2); plot([1,-1],[-1,-1],'linewidth',2); plot([-1,-1],[-1,1],'linewidth',2); plot([-1,1],[1,1],'linewidth',2); plot([1,1],[1,-1],'linewidth',2); 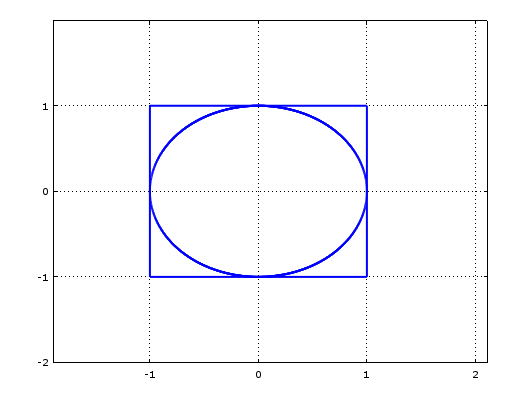
Now suppose we were to sample random points from within the unit square. We can easily check whether a point is inside the circle or outside using the equation of the circle, i.e.:
$ x^2 + y^2 <= 1$
For points that fall inside the circle.
Given the ratio of the circle to the square, we would expect the proportion of randomly selected sample points which end up inside the circle to approach $\pi /4$. And we can therefore use this value to estimate $\pi$.
With the following Octave code we get a sense of what is happening:
hold on x = -1:0.001:1; y = (1 - x.^2).^0.5; plot(x,y,'linewidth',2); plot(x,-y,'linewidth',2); plot([1,-1],[-1,-1],'linewidth',2); plot([-1,-1],[-1,1],'linewidth',2); plot([-1,1],[1,1],'linewidth',2); plot([1,1],[1,-1],'linewidth',2); SampleSize = 1000; Sample = unifrnd (-1, 1, 2, SampleSize); Results = 1:SampleSize; for i = 1:SampleSize Results(i) = Sample(1,i).^2 + Sample(2,i).^2; endfor for i = 1:SampleSize if Results(i) <= 1 plot(Sample(1,i),Sample(2,i),'k'); else plot(Sample(1,i),Sample(2,i),'r'); endif endfor 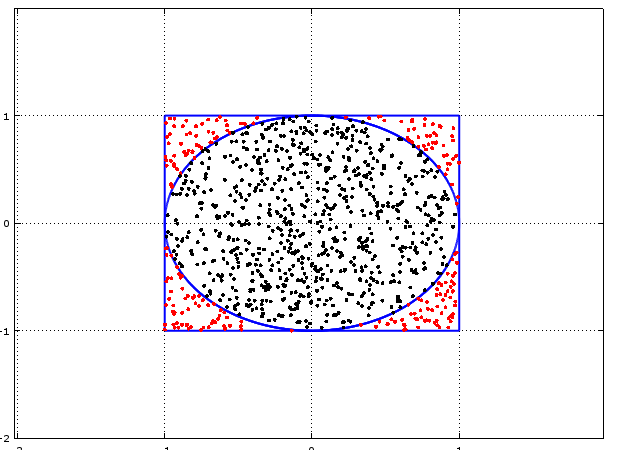
If we count the number of black dots and divide it by the total number of dots then this ratio will allow us to estimate $\pi$.
The final code is: SampleSize = 100000; Sample = unifrnd (-1, 1, 2, SampleSize); Results = 1:SampleSize; for i = 1:SampleSize Results(i) = Sample(1,i).^2 + Sample(2,i).^2; endfor Pi = 0; for i = 1:SampleSize; if Results(i) <= 1 Pi = Pi + 1/SampleSize; endif endfor 4*Pi Why not give it a go yourself!
Now that Brexit is looking like a reality, why stop there? Can we say anything sensible about the merits of seeking even further devolution? What about an English exit from the United Kingdom. One (slightly) tongue in cheek article I read even suggested that Londonxit should also be considered given the difference between how people in London voted in the Referendum, and how the rest of the country voted.
So here is a tongue in cheek analysis of this suggestion. GVA, or Gross Value Added, is a measure of the value of the goods and services added to the economy. The ONS publishes figures for GVA split by region in the UK and the results are interesting:
So the first point to note is that the average person in England is contributing more to the economy as measured by GVA than the average person in Wales, Scotland or Northern Ireland, with Scotland being a close second. In graph form the results looks like this: 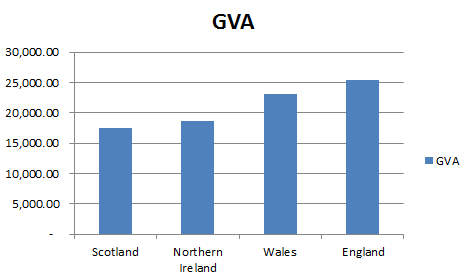
One obvious candidate for why England is more efficient might be that England has higher levels of government investment. The ONS publishes figures on this as well and we can see that in fact the opposite is true:
England in fact has the lowest level of public spending. 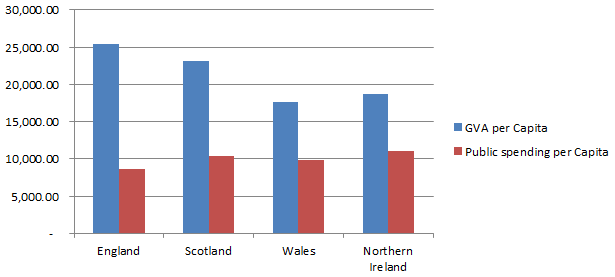
So not only does England have the highest GVA, it is doing so with the lowest public spending per capita! It seems that England is being dragged down with it's fellow UK members. Lets not stop there though,.we can also look at GVA figures on a regional level.
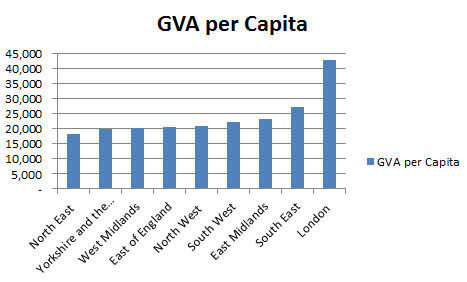
So we see that London is far ahead of the other regions in the UK when measured by GVA. If we once again add in public spending, (which according to the perception created by most media is heavily favoured towards London) we get the following chart: 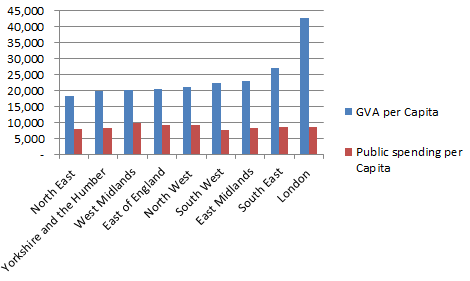
It turns out that public spending is actually pretty level through out England. Therefore on the face of it perhaps it's time for Londonxit after all? |
AuthorI work as an actuary and underwriter at a global reinsurer in London. Categories
All
Archives
April 2024
|
||||||||||||||||||||||||||||||||||||||||||
 RSS Feed