|
This post is a follow up to two previous posts, which I would recommend reading first: https://www.lewiswalsh.net/blog/german-flooding-tail-position https://www.lewiswalsh.net/blog/german-flooding-tail-position-update Since our last post, the loss creep for the July 2021 German flooding has continued, sources are now talking about a EUR 8bn (\$9.3bn) insured loss. [1] This figure is just in respect of Germany, not including Belgium, France, etc., and up from \$8.3bn previously. But interestingly (and bear with me, I promise these is something interesting about this) when we compare this \$9.3bn loss to the OEP table in our previous modelling, it puts the flooding at just past a 1-in-200 level.  Photo @ Jonathan Kemper - https://unsplash.com/@jupp To see why this is interesting we're first going to have to think about Solvency 2. Solvency 2 Many European insurers will buy reinsurance to optimise for Solvency 2 capital relief, and Solvency 2 is calibrated around a 1-in-200 VaR. What is the obvious way to optimise for this metric? An insurer will buy enough reinsurance to cover themselves up to a 1-in-200 year event, the equivalent of a \$9.1bn market loss, as per table below (pasted from last time) and nothing more. Any reinsurance bought beyond the 1-in-200 level will not provide a reduction in 1-in-200 VaR, and therefore will not give you capital relief. 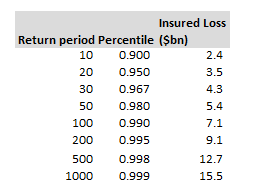 Obviously this simplifies things a little, there's more to it in practice - the insurer would have done lots of complicated things, loaded their policy bordereaux into a commercial model (AIR, RMS, etc.), made sensible decisions about which options to run (demand surge, storm surge, etc.). The reinsurance would have been purchased on a unl basis not on a market loss basis (unl being the insurers share of the market loss, net of recoveries). So the process of calibrating to a 1-in-200 is actually done at the insurer's share of loss level, not at a market loss level. But broadly, the RMS/AIR models are parameterised using the same losses and similar methods as the OEP table above, and it’s not too inaccurate to assume an insurer will pick up cat losses from a market event broadly in line with their market share. So, to return to our original train of thought, what should we expect given the market loss is now projected to be greater than a 1-in-200? We saw there is a compelling reason why an insurer would only buy cover up to this maximum, so surely we should be expecting some insurers to be blowing though their reinsurance at this point? And....drum roll....that is exactly what is being reported: The Insurer on 22nd September [2] had the following headline : “Some regional insurers understood to be going out the top of towers“ Consequences Firstly, if the story I've sketched out above is correct (and I think it is) then it appears that some insurers may have been overly trusting of their cat modelling. The cat models, barring a few exceptions, do not generally adjust for climate change, they are simply calibrated against historic losses. Therefore, if you are using a commercial cat model to inform your reinsurance buying, you are exposing yourself to ‘climate risk’, to the extent to which future losses are likely to be more extreme than historic losses. Secondly, any insurers that have exhausted their reinsurance, will pick up any further loss creep as 100% net retained, which will be quite painful to their 2021 earnings. If the flooding loss does settle right around the 1-in-200 level, then the insurers will in effect have been lucky, with a minimal amount ‘going out the top’. Had the loss been bigger there wouldn't have been any further protection. Caveats Just to pre-empt a few objections to the analysis:
[1] https://www.insuranceinsider.com/article/291adv0pbyoxtvaf8gu0w/reinsurers-bullish-on-1-1-increases-as-eur10bn-bernd-loss-looms [2] https://www.theinsurer.com/news/euro-flood-pain-for-reinsurers-as-smaller-cedants-burn-through-cat-programs/18364.article |
AuthorI work as an actuary and underwriter at a global reinsurer in London. Categories
All
Archives
April 2024
|
 RSS Feed
Leave a Reply.