Types of Excess of Loss Reinsurance24/10/2017 One thing that I got slightly confused about when I started to work at my current job was the difference between the various types of Excess of Loss Reinsurance. The descriptions given in the IFoA notes, those given on Wikipedia, and the use of the terms in the London market are all different.  The underlying contracts are all the same, but different groups have different names for them. I thought I would make a post explaining the differences. Here are the names of the sub-types of Excess of Loss Reinsurance that are used in the London Market:
(The descriptions given below just describe the basic functionality of the contracts. There will be a lot more detail in the contracts. It's always a good idea to read the slip if possible to properly understand the contract. Also, bear in mind that some people in the London Market might use these terms differently. This just represents what I would understand if someone said one of these terms to me in everyday work.) Risk Excess (RXS) The limit and attachment for this contract applies individually per risk rather than in aggregate per loss. (hence why it is called a Risk Excess) So if our RXS is 5m xs 1m and we have a loss involving two risks each of which is individually a 3m loss. The total recovery will be 4m = (3m-1m) + (3m - 1m) Excess of Loss (XoL) The limit and attachment for this contract apply in aggregate per loss rather than individually per risk. So if our XoL is 5m xs 1m and we have a loss involving two risks each of which is individually a 3m loss. The total recovery will be 5m = (6m-1m) Catastrophe XL (Cat XL) The limit and attachment for this contract apply in aggregate for losses to all policies covered by the contract during the duration of a Catastrophe. So if our Cat XL is 500m xs 100m, and there is a Hurricane which causes insured losses of 300m, then the total recovery will be 200m = (300m - 100m) Aggregate XL (Agg XL) The limit and attachment for this contract apply in aggregate for losses to all policies covered by the contract. This will normally be all policies in a single class. So if our Agg XL is 50m xs 10m and covers an Insurer's Aviation account. If the total Aviation losses for the year are 30m. Then the total recovery will be 20m = (30m - 10m)  The IFoA notes The IFoA notes distinguish between three types of Excess of Loss contract.
The definitions for Risk Excess of Loss and Catastrophe Excess of Loss are basically the same as those commonly used in the London Market. The IFoA definition of Aggregate Excess of Loss is different though. The Institute defines an Aggregate Excess of Loss Contract to be an Excess of Loss contract which aggregates losses across multiple risks in some way. This could be across all risks involved in one event, across all policies for a given year, across all losses in a given sub-class, etc. So our standard Excess of Loss contract which we defined above, which aggregates across all risks involved in a single loss, would be considered an example of an aggregate contract according to the IFoA definition! Don't go around Lloyd's calling it an Aggregate Excess of Loss though, people will get very confused. The IFoA definitions are more logical than the ones used in the London Market, where there is an arbitrary distinction between two types of aggregation. Our standard XoL contract does aggregate losses, therefore why not call it an Agg XoL? The reason we do call it that is because everyone else does, which when talking about definitions is a pretty compelling reason, even if it is not the most logical name. Wikipedia The Wikipedia page for Reinsurance (link below) distinguishes between three types of Excess of Loss contract. en.wikipedia.org/wiki/Reinsurance
Per Risk Excess of Loss is once again defined consistently, and the Aggregate Excess of Loss is also consistent with the common usage in the London Market. However, in this case, our standard Excess of Loss contract now falls under the definition of a Catastrophe Excess of Loss Layer. The Wiki article defines a Cat Excess of Loss contract to be one that aggregates across an Occurrence or Event - where event can either be a catastrophe, such as a Hurricane, or a single loss involving multiple risks. Summary You shouldn't get caught up in who is right or wrong, as long as you are clear which definitions you are using. Fundamentally we are talking about the same underlying contracts, it's all just semantics. The definitions that are commonly used in the London Market are not online anywhere that I could see, and it caused me some confusion when I noticed the inconsistency did some googling, and nothing came up. Hopefully this helps clarify the situation to anyone else who gets confused in the future. What even are Ogden Rates anyway? The Ogden tables are tables of annuity factors, published by the Government's Actuary Department, which are used to calculate court awards for claimants who have had life changing injuries or a fatal accident and are eligible for a payout from their insurance policy. For example, consider a 50 year old, male, primary school teacher who suffers a car accident which means that they will not be able to work for the rest of their life. The Ogden Tables will be used to calculate how much they should be paid now to compensate them for their loss of earnings. Suppose the teacher is earning a salary of £33,000 when they have the accident, then under the Ogden Rates prior to March 2017, the teacher would be paid a lump sum of £33,000* 20.53 = £677,490 where 20.53 is the factor from the tables. How did the Government's Actuary Department come up with these factors? The factors in the table are based on two main pieces of information, how long the person is expected to live, and how much money they can earn from the lump sum once they are given it (called the discount rate). It's this second part which has caused all the problems between the Ministry of Justice and the Insurance Industry. The discount rate should be selected to match the return generated on assets. For example, if the claimant puts all their money in shares then on average, they will generate much more income than if they put the lump sum in a savings account. So what should we assume our school teacher will invest their lump sum in? Since the school teacher will not be able to work again, and therefore will need to live off this money for the rest of their life, they will not want to risk losing all their money by investing in something too risky. In technical terms, we would say that the claimant is a risk adverse investor. In order to mimic the investment style of this risk adverse investor, when the Ogden tables were first set, it was decided to assume that the investor would put all their money in index-linked bonds. There are a couple of reasons to assume this, many risk adverse institutional investors do purchase a lot of index-linked bonds, and also, the average discount rate for these bonds is readily available as it is already published by the UK DMO. At the time the tables were set up, this seemed like a great idea, but recently it has made a lot of people very angry and been widely regarded as a bad move. What are Index-linked bonds again? In the 1981 the UK government started issuing a series of gilts which instead of paying a fixed coupon, paid a floating coupon which was a fixed percentage above the rate of inflation. The UK Debt Management Office is responsible for issuing these bonds, and the following website has details of the bonds that are currently in issue. It's quite interesting to see how it all works: www.dmo.gov.uk/reportView.aspx?rptCode=D1D&rptName=50545854&reportpage=D1D The basic principle is if you purchase a bond that pays 2% coupons, if inflation is 3%, they would pay 3%+2%, if inflation was 5%, then they would pay 5% + 2%. Due to the fact that these bonds always gave a fixed real return (2% in this case), institutional investors really like them. Because there is no inflation risk, on average index-linked bonds cost more than fixed coupon bonds once you account for the effects of inflation. Pension Schemes in particular purchase a lot of these bonds, Why do Pension Schemes like these bonds so much? Most pensions are increased annually in line with inflation, due to this Pension Schemes like to hold assets that also go up in line with inflation every year. In order to get real returns on their investments, Pension Schemes traditionally held a mix of shares and index-linked bonds, the shares gave better returns, but the bonds were more safe. This all started to go very wrong after the financial crisis . A huge drop in interest rates and investment returns, combined with soaring life expectancy lead to more and more pension schemes winding up and the remaining ones have funding issues. As the schemes started winding up they became more and more risk adverse and started to move away from the more volatile assets like shares and moved towards index-linked bonds instead. This table from the PPF's Purple Book shows the move away from shares into bonds. 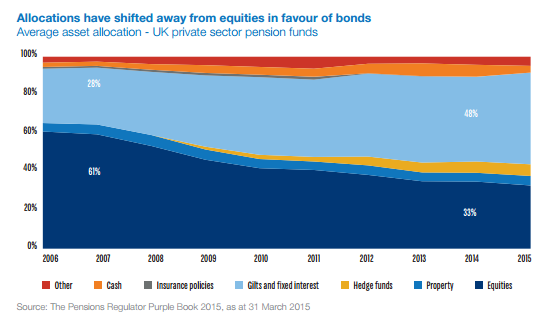 We can see that back in 2006, prior to the financial crisis, Pension Schemes were on average holding around 61% of their assets in equities. When we look again at 2014 this percentage has dropped to 33% and the slack has largely been taken up by bonds. Pension Schemes like these assets so much in fact that Schroders estimated that 80% of the long term index-linked gilts market is held by private sector pension schemes as the following chart shows. Source: www.schroders.co.uk/en/SysGlobalAssets/schroders/sites/ukpensions/pdfs/2016-06-pension-schemes-and-index-linked-gilts.pdf 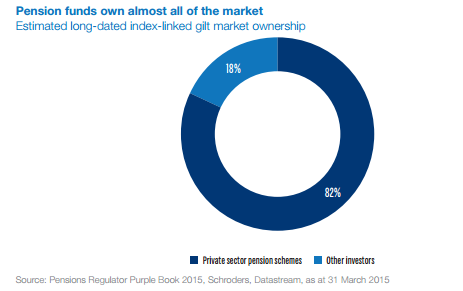 Does it matter that Pension Schemes own such a high proportion of these gilts? The problem with the index-linked gilt market being dominated by Pension Schemes is one of supply and demand. The demand for these bonds from Pension Schemes far outweighs the supply of the bonds. Another chart from Schroder's estimates the demand for the bonds is almost 5 times the supply. Source: www.schroders.co.uk/en/SysGlobalAssets/schroders/sites/ukpensions/pdfs/2016-06-pension-schemes-and-index-linked-gilts.pdf 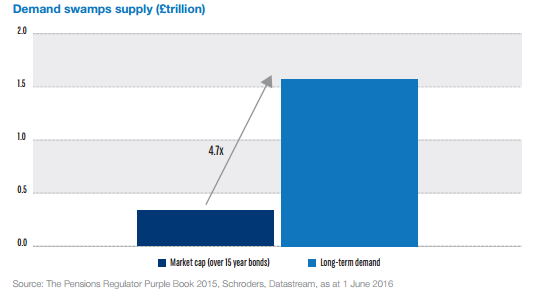 As you might expect with such a disparity between supply and demand, Pension funds have been chasing these assets so much that yields have actually become negative. This means that Pension Schemes on average are paying the government to hold their money for them, as long as it's protected against inflation. Here is a chart showing the yield over the last 5 years for a 1.25% 2032 index-linked gilt. Source: www.fixedincomeinvestor.co.uk/x/bondchart.html?id=3473&stash=F67129F0&groupid=3530 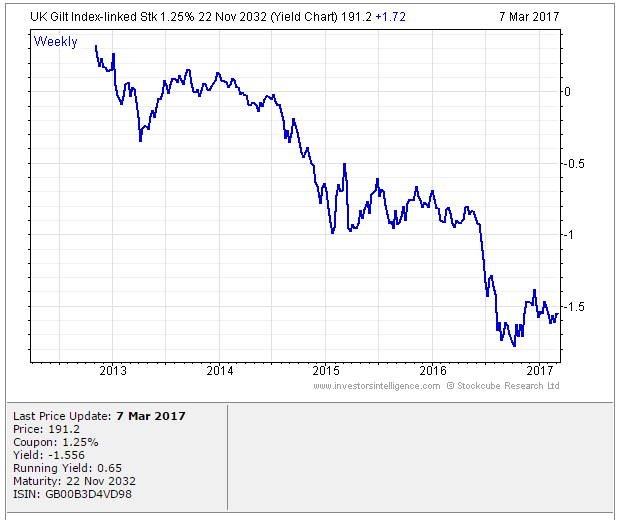 So what does this have to do with Ogden Rates? So now we are in a position to link this back to the recent change in the Ogden Rate. Because the yield on index-linked bonds has traditionally been used as a proxy for a risk-free real return, the yield is still used to decide the discount rate that should be used to calculate court award payouts. Because Pension Schemes have been driving up the price of these bonds so much, we have the bizarre situation that the amount that insurance companies have to pay out to claimants has suddenly jumped up considerably. In the case of a 20 year old female for example, the amount that would be paid out has almost tripled. As these pay outs are already considerable, the financial impact of this change has been massive. So what should the Government do? There is no easy answer, if the Government doesn't use the yield on index-linked gilts to calculate the Ogden rate then there is no obvious alternative. I think the most reasonable alternative would be to use a weighted average of returns on the types of assets that an average claimant would hold. For example, we might assume the claimant is going to hold 50% of their lump sum in cash, 30% in shares, and 20% in bonds, and we would then calculate the weighted return from this portfolio. The issues with doing nothing is that the additional cost from these increased pay outs will inevitably be passed on to the policyholders through higher premiums. So ultimately there is an issue of fairness whereby people who are receiving payouts are being paid a disproportionate amount of money, and this is being subsidised by policyholders other policyholders. Which areas of actuarial work are the best paid? Salary estimates for actuarial work are pretty hard to come by and in my experience not particularly accurate, Also, in practice there are also large differences in salary when accounting for experience, practice area, function, and location. So I thought I'd try to put together my own analysis which accounts for all these variables! As a source of data I decided to work from online Job Adverts, mainly because I can collect them with a minimum of effort, but also because the only other option would be to send out my own survey (and to be honest why would anyone complete a salary survey from a random guy online?). Step 1. Collect Some Data I started by web scraping about 800 job adverts from an actuarial job site. This was all the job which were listed on the website at the time. Since this might be 'slightly' (i.e. completely) against the terms of service of the site, I won't say which site the adverts are from or publish any of the raw data. I don't see any issues with publishing aggregated data from the website though. Once I had scraped the adverts, I extracted the salary figures and discarded adverts that did not include a salary, this left about 350 job advert to work with. Step 2. Analysis My first step was to segment the adverts by practice area. Rather than going through each advert one at a time, I split them by looking at key words in the adverts, for example, adverts containing the terms 'pensions', 'employee benefits', or 'defined contribution' were all assigned to the category 'Pensions'. These figures were then used to produce the following box and whiskers chart: 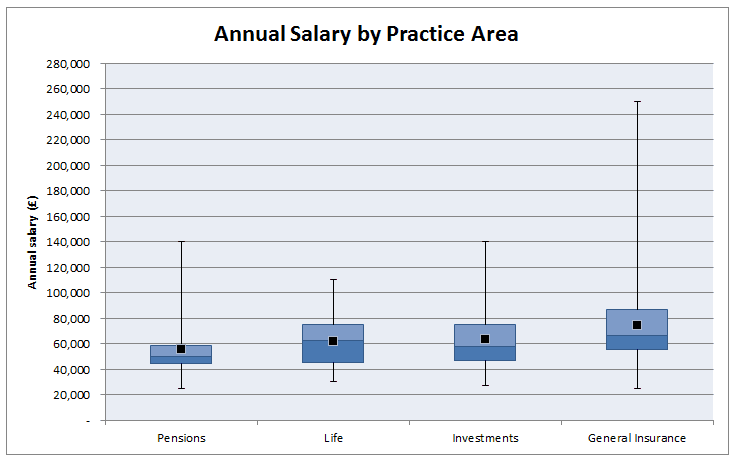 As expected, General Insurance comes out as the highest paid practice area with Life and Investments in joint second place and Pensions lagging quite a bit behind. In case you can't remember how a box and whiskers chart works, the black dot is the mean, the three lines in the box represent the 1st quartile, median, and 3rd quartile, and the whiskers go up to the maximum and down to the minimum value. Are there any other correlations that are affecting this ranking though? Since a lot of GI jobs are based in London, does London's higher average salary accounts for the difference? First let's check that actuarial jobs in London do actually have higher salaries than actuarial jobs outside London. 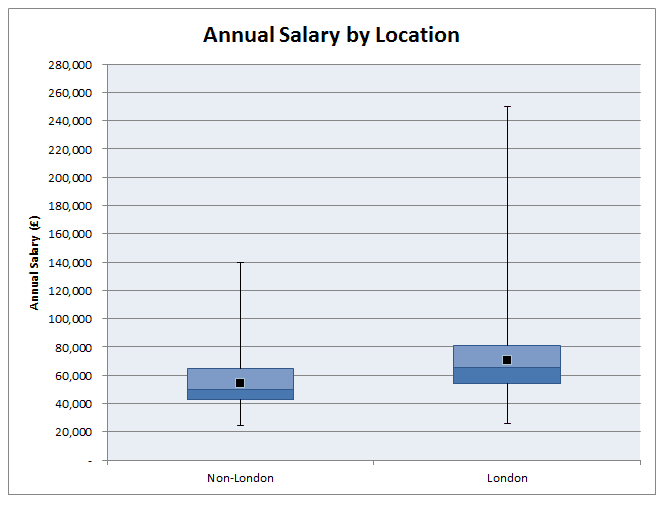 As expected, London based jobs are clearly better paid on average than non-London based jobs. In order to see whether location is driving the differences between salaries across practice areas we need to include location as another variable in our chart: 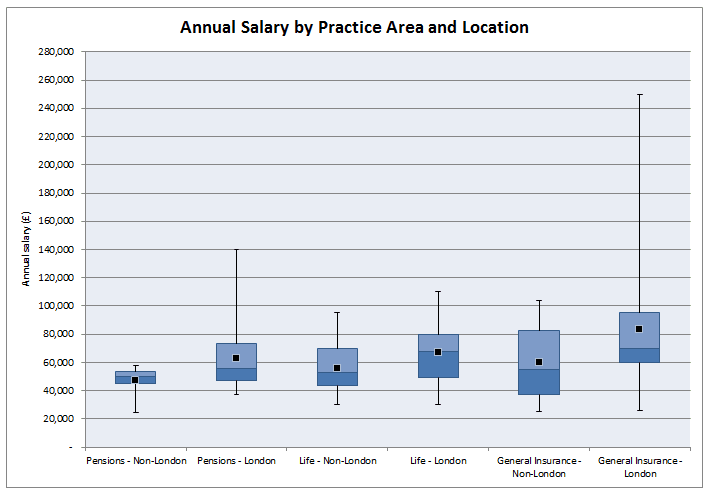 This chart gets a bit more messy, but we can see that even when we account for the effect of location, we still have the same ordering of practice area: General Insurance > Life > Pensions Now that we've looked at practice areas, I'm going to show my bias towards insurance and look at the effect of the type of actuarial work within an insurance company on salary. 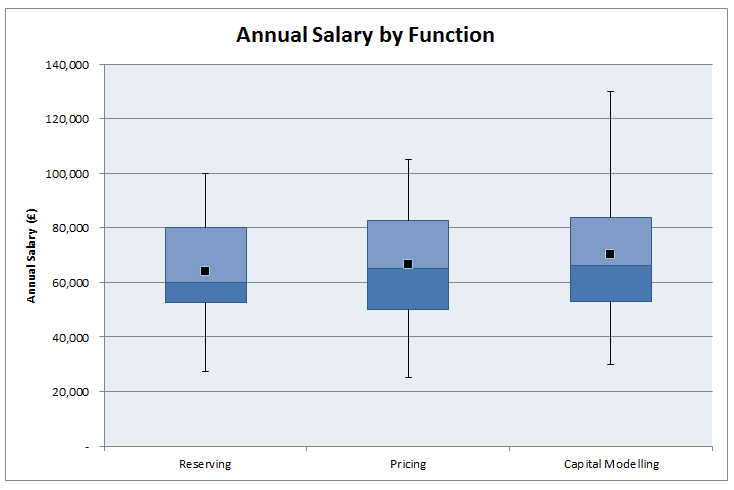 Surprisingly, all the functions are relatively equal. There seems to be a weak ordering of: Capital Modelling > Pricing > Reserving Though the difference does not seem to be significant. 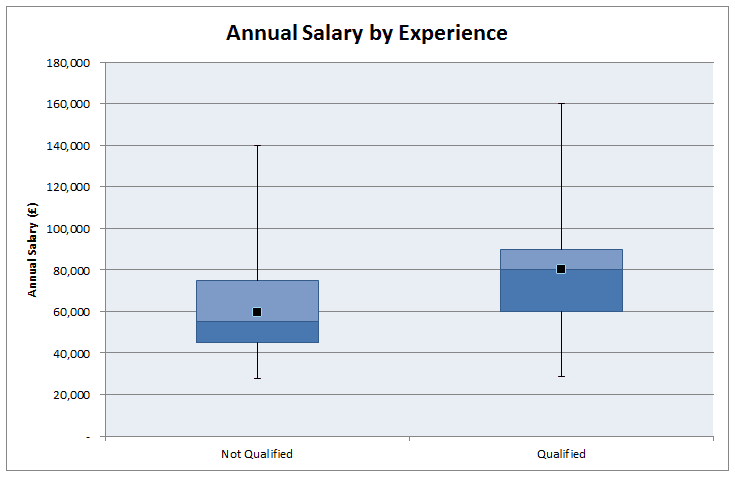 Finally, let's look at the effect of qualifying on salary. As expected, jobs for qualified actuaries have a mean of £20,000 higher than part/nearly qualified positions. All the more reason I should be studying right now rather than procrastinating on here!. Background Lloyd’s or Lloyd's of London is an insurance marketplace located in the City of London. It developed out of an informal meeting of ship owners, merchants and sailors in Edward Lloyd's coffeehouse. The original coffeehouse first opened in 1688 making Lloyd's over 300 years old. Lloyd's really is a unique and interesting institutional, and there is really nothing else quite like it. For example, did you know that Lloyd's uses an accounting system that runs for thee years rather than the usual one year accounts that most companies use? Three years was the length of time that a 17th century ship took to circumnavigate the globe, and since most of the business written at Lloyd's during it's early years was Marine insurance, it was decided that it was a good idea to run the accounts for three years and it hasn't changed since. But how does Lloyd's work in practice? Who pays whom for what and how do they decide how much to pay? And how do people make money from all of this? 
Syndicates Syndicates are the basic building blocks of Lloyd's. The word syndicate just means a group of people and in the context of Lloyd's, a Syndicate is a group who are willing to collectively write insurance. Is there a name for the people who make up the Syndicate? Yes there is! They are called Members. The Members join together to form a Syndicate. Members come in many different forms, some will be individual investors, who might have a relatively modest net worth, others will be specialist insurance companies, set up specifically to write business at Lloyd's and worth billions of dollars. The word Member applies equally to both. Members which are set up as companies are called 'Corporate' members, and contribute the majority of the capital at Lloyd's. Individual investors in Lloyd's are called 'Individual Members', or 'Names'. Historically Names made up a majority of the capital, but they are less important now. Even though the Syndicate is the one who provides the insurance to the policyholder, they will not sell the insurance directly to the policyholder, instead a Syndicate will employ a Managing Agent (not to be confused with a Managing General Agent - MGA - which is a separate type of entity) to underwrite the insurance on its behalf. Some Managing Agents will deal with multiple Syndicates and some will deal with just one Syndicate. The Managing Agent will most often arrange the insurance through insurance brokers. That's quite a few different groups, so here's an image showing how they all fit together. 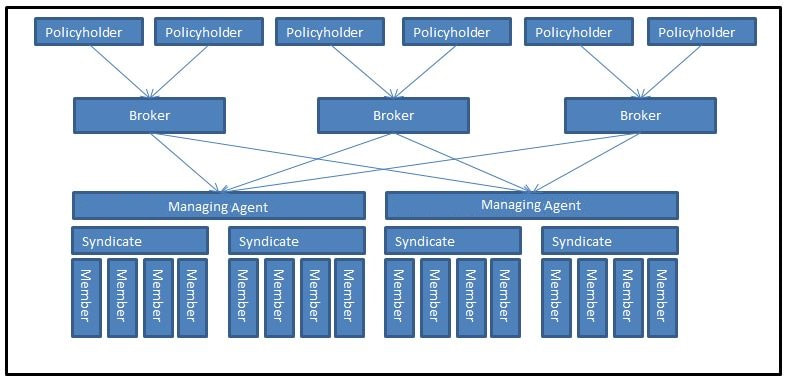
How do Members make money at Lloyd's?
Members agree to write business at Lloyd's for one year at a time. A given year of account will then be kept open for three years. (Remember earlier when we mentioned that this was the length of time it took a 17th century ship to circumnavigate the globe, that's where this number comes from) At the end of the three years, the syndicate will settle up all the outstanding business through a process called Reinsurance to Close (RITC), and then all the profits or losses from all the from all the contracts the Syndicate has written in that year are shared among the members in proportion to the amount of capital they provided to the Syndicate. For example, suppose that in a given year Syndicate A made a profit of £10m and suppose that Member Z provided 2% of the capital that the Syndicate required that year. Then Member Z would receive a payment of £10m * 2% = £200,000. On the other hand, suppose that Syndicate A actually lost £10m over the year, then Member Z would be liable to cover their share of the loss, in this case, £200,000. Therefore all the Members of a Syndicate share in the fortunes of the Syndicate. Here is a graphic with a very simplified example showing a timeline of how this would work in practice. 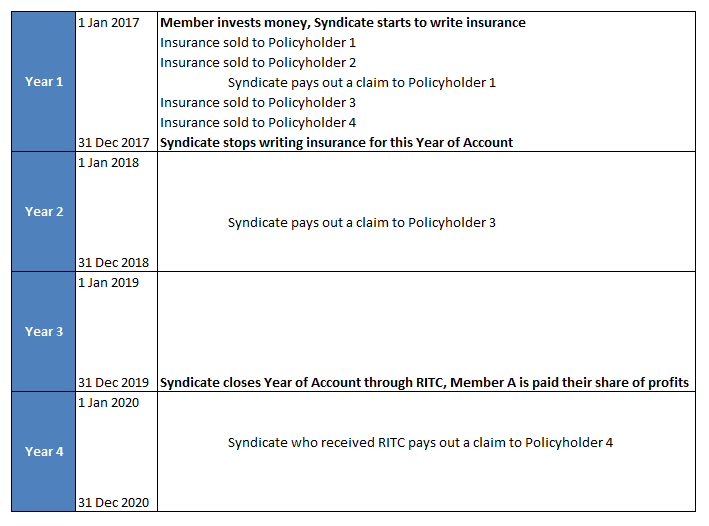
How do Syndicates get business?
Business at Lloyd's is placed through insurance or reinsurance brokers. A policyholder will approach a broker and ask them to arrange an insurance contract at Lloyd's. The broker will then typically place the contract at Lloyd's through the 'slip system'. Slip System The broker will produce a 'slip' which contains all the details of the risk which is to be insured. For example, a slip might be a contract to insure a large industrial plant from fire damage. Syndicates (through their Managing Agent) may then decide to underwrite a percentage of the slip. What this means in practice is the syndicate will take a percentage of the premium, and then if there is a loss, they will be liable for a percentage of the insurance claim. For example a syndicate might take 5% of the risk. This means that they will receive 5% of the premium that the policyholder pays and be responsible for 5% of the claims arising from the contract if there is fire damage to the industrial plant. The process of spreading the risk around different syndicates is known as coinsurance. As an aside, this is where the term 'Underwriter' originally comes from. When an insurer writes a share of a risk (also known as 'taking a line on the risk'), they will sign their name at the bottom of the slip, along with the % share they are willing to write. Hence the term 'underwriter' - people who write their name under the text of the document. Isn't this unneccssarily complicated though? What's the point of everyone take a share? Why can't one syndicate just take on 100% of the risk? The answer is they can, and sometimes do, particularly for smaller risks. However it will probably be very hard to find a syndicate that is willing to take 100% of a very large risk. Going back to our industrial plant example, if the plant is worth hundreds of millions, the claim size could potentially be in the hundreds of millions too. Let's pause to think about what's going on here then. We saw in the previous section that all the members in a syndicate share the profits and losses from all the contracts that the Syndicate writes in the year, but we now have another type of sharing in the form of coinsurance. So for a given contract we might have a dozen syndicates all sharing the risk, and inside each syndicate we might have dozens of members also sharing the risk of their syndicate. Therefore each contract could potentially be shared by hundreds of members! The following graphic shows how the slip system works. 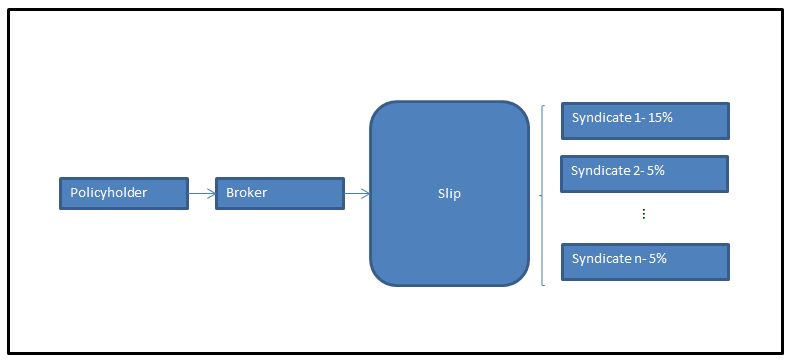

Capital Requirements Any time an insurance contract is written, capital is required to cover the possibility that the claims might be larger than the premiums. Otherwise there is a risk that a policyholder might not be able to claim from the insurer if the insurer gets into financial trouble. Given the complicated way that business is written at Lloyd's, how do we decide how much capital to take from each member, and how is this capital held? The policyholder will pay a premium to the insurer in exchange for the insurer taking on the risk. We saw earlier that this premium will be spread among multiple syndicates depending on which ones sign the slip. Each syndicate will hold the premium it receives from policyholders in a Premium Trust Fund (PTF). The PTF will be a pool of all the premiums that the insurer receives throughout the year, rather than the Syndicate keeping separate funds for each policy written. What happens though if the claims are larger than the premiums across all the business written for the year? The syndicate will run out of money in their PTF and will need additional capital. To cover this possibility members will deposit 'Funds at Lloyd's' (FAL) with their Syndicate. For a given syndicate, if their PTF proves to be inadequate to cover claims, then the syndicate will have made a loss and the FALs will be used to make up the difference. What happens in the unlikely event that even the FALs are too small to cover the claims? To cover this eventuality, all members are also required to contribute a small amount every year to the Lloyd's central fund. This fund is only used to pay claims if the FALs for a given syndicate prove inadequate. The following graphic illustrates this process. 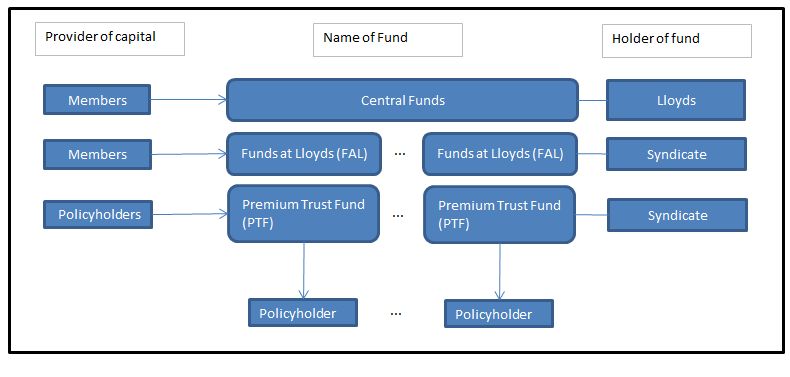
If you enjoyed this article, but would like to find out more, I have also written a FAQs about Lloyd's which can be accessed through the link below:
www.lewiswalsh.net/blog/faqs-about-lloyds-of-london
Why do we use the Poisson Distribution as the default distribution for modelling Claims Frequency for an insurance portfolio?
Why do we even have a default? When we are setting up a frequency-severity model to model claims from a insurance portfolio, we will normally approach the fitting of a frequency distribution and the fitting of the severity distribution quite differently. For the frequency distribution the standard approach is to attempt to fit a Poisson distribution, and only look at other distributions if the Poisson is not a good fit (even then we normally limit our search to Negative Binomial, and maybe Binomial at a stretch) When we fit a severity model however, we will often fit quite a large range of different continuous probability distribution to the empirical Claim Severity CDF using some sort of curve fitting software and then select the most appropriate curve. Some Distributions are used more often than others, for example, LogNormal, Pareto, Weibull are all common curves to use, but there is no single curve that we would assume the severity distribution conforms to by default. So why is a Poisson distribution a natural distribution to use to model claims frequency? And why is there no 'natural' distribution for claim severity? In this post I thought I would write up an interesting result that shows that a counting distribution which has a number of basic properties will be distributed with a Poisson distribution. We will then be able to see that are reasonable assumptions to make about Claims Frequency for an insurance portfolio.
Poisson Distribution
Before working through this result, here are a list of additional properties the Poisson Distribution has which make it easy to work with:
$$ N \sim Poi( \lambda )$$
Then
The Result
Let $A(t)$ for ($t >0$) denote the the number of claims in the interval $[0,t]$. With $A(0) = 0$.
Suppose:
$$P( A(t + \delta t) - A(t) \geq 2 ) = o( \delta t)$$
The Proof
Define $P_n (t) = P( A(t) = n ) $
We then examine the change in $P_n(t)$ over a time period $\delta t$ and then take the limit as $\delta t$ approaches $0$.
for $n > 0$: $$P_n(t + \delta t) = P_n(t)(1 − \lambda \delta t) + P_{n−1} (t) \lambda \delta t + o( \delta t) $$ for $n = 0$: $$P_0(t + \delta t) = P_0(t)(1 − \lambda \delta t) + o( \delta t)$$
This follows from the facts that there are two distinct ways for $n$ claims to happen in a time period $t + \delta t$. Either we get $n$ claims in time $t$ and no claims in $\delta t$, or $n-1$ claims in time $t$ and one claim in $\delta t$.
We can rewrite these equations as: for $n > 0$: $$\frac { Pn(t + δt) − Pn(t)}{\delta t} = \frac {−P_n(t)( \lambda \delta t) + P_{n−1}(t) \lambda \delta t + o(\delta t)} { \delta t}$$ for $n = 0$: $$\frac {P_0 ( t + \delta t) − P_0(t)} {\delta t} = \frac {P_0(t)(− \lambda \delta t) + o(\delta t) } {\delta t}$$ Now take the limit as $\delta \to 0$ which gives: for $n>0$: $$\frac { d P_n (t)} {dt} = − \lambda P_n(t) + \lambda P_{n−1}(t)$$ for $n=0$: $$\frac {d P_0 (t)} {dt} = - \lambda P_0 (t)$$ From inspection we can see that $P_0 (t) = e^{ {- \lambda} }$ The proof for the general case can easily be shown with induction. We therefore see that $P_n$ has a Poisson distribution.
Poisson as the natural distribution
So we see that, in so far as insurance claims occur in line with the assumptions (independently over the time interval, and only one at a time) we can expect the claims frequency to have a Poisson Distribution. In addition, the Poisson Distribution has a number of properties which make it easy to work with - having a single parameter, having simple formulas for the mean and variance, etc. Therefore, whenever we are fitting a claim frequency model, we will almost always try the Poisson Distribution first. Captive Insurance31/1/2016 Here is an Acronym I came up with for remembering the reasons for setting up a captive Insurance company:
Claims control Access to Reinsurance Profit loading and Acquisition costs Tax and Regulatory optimization Investment income Volatility in premium rates Extension of coverage Claims control - As the captive is directly controlled by the parent company, the parent company is free to establish the claims handling procedures. For example, they may wish the captive to operate a very liberal interpretation of what is covered under the policy, thereby reducing the possibility that the parent company will be exposed to a financial loss which they thought they were indemnified from. If the parent company were dealing with a commercial insurer instead then they would be at the mercy of the exact policy wording. Access to Reinsurance - By self insuring, the parent company gives itself the option of then ceding the risk directly to a reinsurer rather than going through an insurance company. Reinsurers tend to enjoy greater economies of scale than direct writers, and incur lower acquisition and claims handling costs due to the smaller number of clients they deal with. Therefore the premiums charged by a reinsurer would be lower than that charged by a direct writer. Profit loading and acquisition costs – Due to the fact that most insurers are run as limited liability companies, the premiums that are charged by the insurer will be loaded for profit. There will also be significant loadings for expenses and acquisition costs (the costs associated with acquiring new business). By setting up a captive the parent company can eliminate these loadings and instead just pay a pure risk premium. These loadings can be significant, sometimes as high as 50%. Investment Income – The captive will be required to hold capital to cover the liabilities that it is taking on by accepting the risk from the parent company. This capital can be invested and the investment income retained in the captive. This investment income would otherwise be earned by the insurance company. (Admittedly the insurance company would be expected to reflect this fact in the premium that it charges however this may not always be the case) Volatility in premiums rates - If the parent company uses a commercial insurer rather than a captive then the premium charged by the insurance company will be partly market driven. Premium rates vary over time in line with the underwriting cycle beyond how they would be expected to vary based on the pure risk premium. The underwriting cycle is related to the cost of capital and the level of profit and competition between insurance companies. This can add an additional level of volatility to the premiums paid by the parent company. By setting up a captive the parent company can help stabilize the premiums that it pays. Extend coverage – Insurers may be unwilling to accept certain risks which they deem to large or too unique, or they may charge premiums that are excessively cautious when taking on these risks. The ability to dictate to a captive the risks that it should accept extends the coverage available to the parent company. This is one of the primary reasons for setting up a captive. |
AuthorI work as an actuary and underwriter at a global reinsurer in London. Categories
All
Archives
April 2024
|
 RSS Feed