Using Monte Carlo Methods to estimate Pi13/7/2016 Monte Carlo Methods Monte Carlo methods, named after the area in Monaco famous for it casinos, are a collection of mathematical methods that use repeatedly sampling of random numbers to solve mathematical problems. They are commonly used to simplify problems that would otherwise be impossible or too time consuming to solve if we were forced to use analytical methods. An example Suppose we are given the option of playing the following game in a casino: The game costs £5 per play. The game involves you rolling 10 dice. If the sum of the dice is greater than 45, you win £10, otherwise you don't win anything. Should you play this game? Off the top of my head, I've got no idea whether this is good value or not. Given we are in a casino, I'm going to guess we would lose money over the long run, but what if we wanted to know for sure? We could work out the answer analytically, we could say things like the probability of rolling a 45 using 7 dice is impossible, but using 8 dice it is.... then work recursively from there and it would take a long time and would be quite tedious. An alternative approach would be to set up a model that would simulate the playing of this game, run the model a few thousand times (which should take seconds) and then see what the long term position is when we average across all the games. Much more interesting. I quickly set up a test of the game, and it turns out it is very bad value. On average we would expect to lose about £4.60 every time we play! The interesting point though is that it took me a couple of minutes to work this out, compared to the hours it would have taken me to calculate it analytically. Monte Carlo Methods in insurance Monte Carlo methods are also commonly used in insurance. For example, in reinsurance pricing, when attempting to find an expected value for a loss to an excess of loss layer we may have a good idea of the size and frequency of the ground up losses, say we know that the frequency of losses is distributed according to a Poisson distribution with a known parameter, and the severity of the losses is distributed according to a Log-normal distribution with known parameters. What can we say about the loss to the layer however? It may be theoretically possible to derive this analytically in some cases, but generally this will be too time consuming and may not even be possible. A Monte Carlo approach, like the dice game earlier, involves repeatedly playing the game, we imagine that we write the contract and we then sample values from the frequency and severity distributions to generate sample loss amounts, we can then apply all the contract details to these generated loss amounts. This process of sampling is repeated tens of thousands of times and by averaging across all our simulations we can derive estimates of the expected loss to the layer or any other piece of information we may be interested in. Other uses of Monte Carlo Methods We can also use Monte Carlo methods in other situations where we wish to estimate a value where analytical methods may fall short.
One example of this is in calculating the value of $\pi$. We use the fact that the area of a unit circle is $\pi$. If we imagine the unit circle sitting inside a unit square, then the area of the unit square is 4, and the ratio of the area inside the circle to the area inside the square is $\pi : 4$. Here is some Octave code to generate a picture:
hold on x = -1:0.001:1; y = (1 - x.^2).^0.5; plot(x,y,'linewidth',2); plot(x,-y,'linewidth',2); plot([1,-1],[-1,-1],'linewidth',2); plot([-1,-1],[-1,1],'linewidth',2); plot([-1,1],[1,1],'linewidth',2); plot([1,1],[1,-1],'linewidth',2); 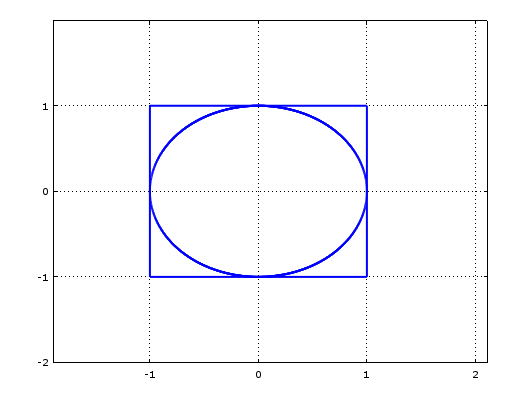
Now suppose we were to sample random points from within the unit square. We can easily check whether a point is inside the circle or outside using the equation of the circle, i.e.:
$ x^2 + y^2 <= 1$
For points that fall inside the circle.
Given the ratio of the circle to the square, we would expect the proportion of randomly selected sample points which end up inside the circle to approach $\pi /4$. And we can therefore use this value to estimate $\pi$.
With the following Octave code we get a sense of what is happening:
hold on x = -1:0.001:1; y = (1 - x.^2).^0.5; plot(x,y,'linewidth',2); plot(x,-y,'linewidth',2); plot([1,-1],[-1,-1],'linewidth',2); plot([-1,-1],[-1,1],'linewidth',2); plot([-1,1],[1,1],'linewidth',2); plot([1,1],[1,-1],'linewidth',2); SampleSize = 1000; Sample = unifrnd (-1, 1, 2, SampleSize); Results = 1:SampleSize; for i = 1:SampleSize Results(i) = Sample(1,i).^2 + Sample(2,i).^2; endfor for i = 1:SampleSize if Results(i) <= 1 plot(Sample(1,i),Sample(2,i),'k'); else plot(Sample(1,i),Sample(2,i),'r'); endif endfor 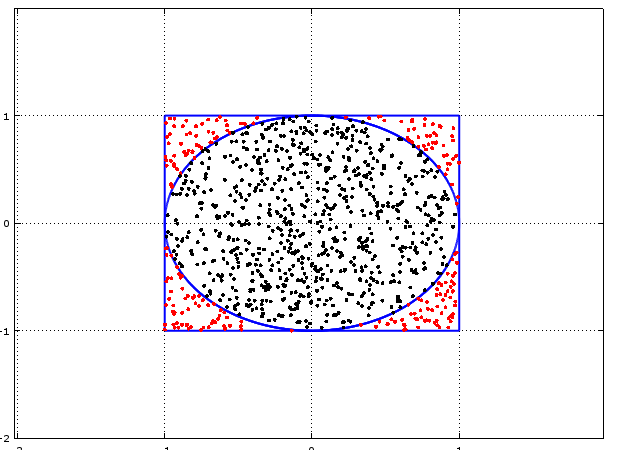
If we count the number of black dots and divide it by the total number of dots then this ratio will allow us to estimate $\pi$.
The final code is: SampleSize = 100000; Sample = unifrnd (-1, 1, 2, SampleSize); Results = 1:SampleSize; for i = 1:SampleSize Results(i) = Sample(1,i).^2 + Sample(2,i).^2; endfor Pi = 0; for i = 1:SampleSize; if Results(i) <= 1 Pi = Pi + 1/SampleSize; endif endfor 4*Pi Why not give it a go yourself! |
AuthorI work as an actuary and underwriter at a global reinsurer in London. Categories
All
Archives
April 2024
|
 RSS Feed
Leave a Reply.