|
Okay, that's a bit of an exaggeration, but there’s a quirky mathematical result related to these deals which means the target loss cost can often end up clustering in a certain range. Let’s set up a dummy deal and I’ll show you what I mean.

Source: Jim Linwood, Petticoat Lane Market, https://www.flickr.com/photos/brighton/4765025392
I found this photo online, and I think it's a cool combo - it's got the modern City of London (the Gherkhin), a 60s brutalist-style estate (which when I looked it up online has been described as "a poor man's Barbican Estate"), and a street market which dates back to Tudor times (Petticoat lane). ADC pricing Suppose we are looking at an at-the-money ADC where carried reserves are \$500m. To keep the maths simple, let’s suppose the reinsurer has completed their reserve review, and the best estimate reserve is also equal \$500m. If there’s a shortfall or surplus, the maths doesn’t change too much anyway. We’re also going to ignore investment returns for the time being. We are going to model the distribution of ultimate reserves with a lognormal distribution, so we need to determine two parameters – $\mu$ and $\sigma$. We already set the mean of the distribution to \$500m, which gives us $\mu$, so we just need to determine the volatility. Let’s stick in 15% as our value for the CV for the time being, and revisit this part later (the CV pick ends up having an interesting effect, so let’s save that discussion for later) Next up, we need to think about what a sensible ADC structure would be. This is an at-the-money, so we know the attachment, but we don’t know the limit. Ideally the cedant would like maximum capital relief, so one sensible limit is to buy up to the 1-in-200 percentile of the ultimate reserve. i.e. limit = (99.5th percentile – attach) & attach = mean Here’s our summary table so far. 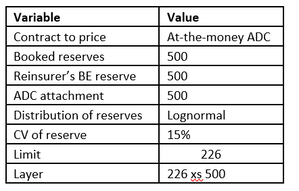
And that’s all we need to put an expected loss cost against the contract. I wrote a quick Python script to do just that, and then ran it for a grid with mean running from \$500m – 3bn, in 500m increments, and CV running in 5% increments from 5% - 25%. The final table then outputs the expected loss, expressed as a % of limit.
In [2]:
import numpy as np
from scipy.stats import lognorm
from scipy.integrate import quad
import pandas as pd

from math import exp
from math import log
from math import sqrt
In [6]:
def integrand(x, excess, limit):
    return min(limit, max(x - excess, 0)) * lognorm.pdf(x, s=sigma, scale=np.exp(mu))


means = []
cvs = []
outputs = []

for mean in [500,1000,1500,2000,2500,3000]:
    for cv in [0.05,0.1,0.15,0.2,0.25]:

        means.append(mean)
        cvs.append(cv)

        stddev = mean*cv
        mu = log(mean/(sqrt(1+stddev **2/mean**2)))
        sigma = sqrt(log(1+stddev**2/mean**2))
        excess = mean
        limit = lognorm.ppf(0.995, s=sigma, scale=np.exp(mu)) - mean
        result, _ = quad(integrand, excess, excess+limit, args=(excess, limit))
        outputs.append(result/limit)

# Create DataFrame
df = pd.DataFrame({
    'Mean': means,
    'Coefficient of Variation': cvs,
    'Output': outputs
})

df_pivot = df.pivot(index='Mean', columns='Coefficient of Variation', values='Output')

# Print the DataFrame
print(df_pivot)
Coefficient of Variation      0.05      0.10      0.15      0.20      0.25
Mean
500                       0.140955  0.133088  0.125675  0.118723  0.112229
1000                      0.140955  0.133088  0.125675  0.118723  0.112229
1500                      0.140955  0.133088  0.125675  0.118723  0.112229
2000                      0.140955  0.133088  0.125675  0.118723  0.112229
2500                      0.140955  0.133088  0.125675  0.118723  0.112229
3000                      0.140955  0.133088  0.125675  0.118723  0.112229
In [ ]:
Observation 1 - mean invariance The pricing is invariant to changes in the mean – i.e. assuming we update all the other values in line with changes to the mean, for a given CV, the loss on line does not change at all. We can see that from the table by the fact that the columns all have identical values for a given CV. Perhaps not too surprising? Effectively we are saying that we would charge twice as much for a transaction which is twice the size. Observation 2 - cv invariance? The more interesting observation, is that actually the loss on line does not really change too much as the coefficient of variation changes, and that it actually reduces as the CV increases... this was more surprising to me. When the CV increases from 5% to 25%, which is a factor of 5, and represents the difference between a fairly stable book at 5% CV, to a fairly volatile book at 25% CV, the loss on line only changes by less then 3 percentage points. Now why is this surprising, and why does it happen? The reason we might expect the loss on line to increase rather than decrease as the CV goes up is that we are offering non-linear protection on a more volatile book, so surely this should cost more? But actually what happens is that as the CV increases, the limit that a client is likely buy increases due to the 99.5th percentile moving out, and this increase in limit more than offsets the increase in loss cost due to increased volatility. Analytical approach We figured out the above using a numerical integration package in python, but we could have also attempted to approach it analytically, by showing that the expected loss on line for the ADC, as expressed by the following integral, is a (slowly) decreasing function of the CV.
$$ \frac{1}{Q_{0.995} - \mu} \int_{\mu}^{Q_{0.995}} \frac{1}{x\sigma \sqrt{2\pi}} e^{-\frac{(\ln x - \mu)^2}{2\sigma^2}} \, dx $$
|
AuthorI work as an actuary and underwriter at a global reinsurer in London. Categories
All
Archives
April 2024
|
 RSS Feed
Leave a Reply.