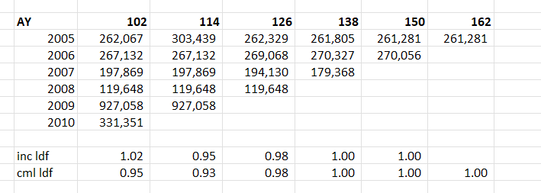
When chain ladders goes wrong8/2/2024 I received a chain ladder analysis a few days ago that looked roughly like the triangle below, but there's actually a bit of a problem with how the method is dealing with this particular triangle, have a look at see if you can spot the issue. Maybe it's obvious to you straight away, maybe not. If we look at age-to-age factors though I think the issue jumps out in a much clearer way. When looking at these factors, we can see that something weird is happening in the 2005 year. It looks like maybe a case reserve was put up and then taken down in the next development period. Ideally we don't want to incorporate this up and down effect when projecting the more recent years to ultimate. You might think to yourself - given the chain ladder is multiplicative, it doesn't much matter having an up and then a down as the two will cancel each other out when the two factors are multiplied together, i.e. 1.16 *0.86 = 1. A problem does creep in here though because when we use the chain ladder method, we don't just multiply the individual factors. The down factor (0.86), is given a greater weighting in the weighted average calc when determining the incremental ldf than the up factor (1.16). This is partly due to there being an additional year of data in the upper calc, but also particularly acute in this example, as the additional year that drops off is outsized compared to the other years - it's about 4 times bigger than the average of the other years. So whereas the 1.16 is given 17% weighting in the incremental ldf calc, the 0.86 is given 34% weighting, which means the two definitely do not cancel each other out. In fact, a 'standard' chain ladder is nothing more than a weighted average of the individual age-to-age factors, weighted by incurred loss. There's some reasons to prefer this approach as opposed to using a straight average or something else, but there's certainly nothing wrong with deviating from the weighted average if the method is not performing correctly. By including this feature of our data, the cml ldf for 2010 ends up being a factor of 0.95. By correcting for this feature, the ldf to ult for 2010 ends up only being 0.98. Let the data speak I think there's an increased awareness in actuarial modelling, possibly driven by the influence of machine learning, of not making arbitrary adjustments to our data in an attempt to correct perceived issues, but instead just letting the data 'speak for itself'. I think the above is a clear example of a case where this approach of just letting the data speak for itself is probably not serving us well, as our model is simply not working as intended. |
AuthorI work as an actuary and underwriter at a global reinsurer in London. Categories
All
Archives
April 2024
|


 RSS Feed
Leave a Reply.