|
On why it doesn’t really make sense to fit a Pareto distribution with a method of moments.
I was sent some large loss modelling recently by another actuary for a UK motor book. In the modelling, they had taken the historic large losses, and fit a Pareto distribution using a method of moments. I thought about it for a while and realized that it didn't really like the approach for a couple of reasons which I'll go into in more detail below, but then when I thought about it some more I realised I'd actually seen the exact approach before ... in an IFoA exam paper. So even though the method has some shortcomings, it is actually a taught technique. [1]

Following the theme from last time, of London's old vs new side by side. Here's a cool photo which shows the old royal naval college in Greenwich, with Canary Wharf in the background. Photo by Fas Khan
Problem 1 – existence of moments
The first thing to note is that we are looking at the 2 parameter (or type 2) Pareto, and we are going to be following Klugman in using alpha and theta to represent our parameters. This is not universal usage though and Wikipedia for example uses alpha and sigma. The alpha parameter determines the tail weight, and a lower value of alpha gives us a heavier tailed distribution. Theta just determines the rest of the shape of the curve, but generally for a Pareto it's the alpha which is the most important value, particularly if we are projecting out into a part of the curve which is beyond our previous largest loss. Klugman [2] gives us the domain on which the moments of a Pareto Type 2 distribution are defined, and looking at the formulas in the table below gives us the clue to the first problem : 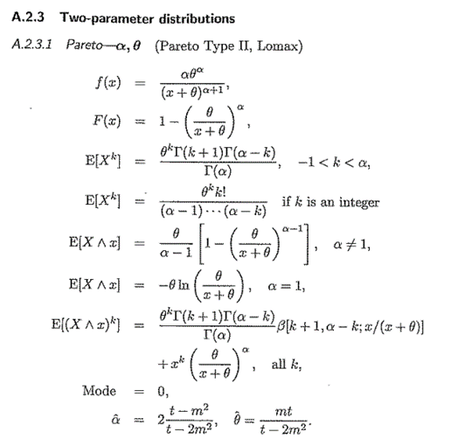
Based on this table, we can see that the mean is only defined when alpha > 1, and the variance is only defined when alpha > 2. (which we can see when we insert k=1 or k=2 into the third formula)
Now why is this important? You might reason that for any given data, the sample mean and sample variance always exist and are always finite, so we will always be able to fit a well defined pareto to our data, no problem. The issue is that for many situations, we expect an alpha value below 2, and we will never produce such a fitted distribution when using the method of moments. In fact, in certain situations we expect an alpha below 1, which we will definitely not produce. Therefore, even though we are using a heavy tailed distribution, we are limiting ourselves to only be able to generate alpha values which are likely to be too light. What is a reasonable prior range for our alpha value to fall in? Fackler [3], for example talks about MTPL curves often having alpha values less than 2, and property cat severity curves having alpha values which are often below 1. And just to note, this is consistent with datasets I've modeled. So when fitting a Pareto using a method of moments to property cat data, we are almost guaranteeing ourselves a fit which is too light, and which is likely to lose us money if we were to rely on it.
Problem 2 – is the sample representative?
There’s another more subtle problem with a method of moment approach. If we think a heavy tailed distribution like a Pareto is appropriate for type of situation we are modelling, then the mean and variance of any sample is likely to be unrepresentative, and specifically lower, than the mean or variance of the distribution generating the data. We can actually model this process ourselves, lets set up a numerical simulation where we repeatedly generate 50 losses from a Pareto distribution with a given mean and variance. The value of 50 could be varied, and the result is more extreme the fewer losses we include, but 50 is not unusually small compared to a standard large loss history. We then examine the distribution of the sample mean and sample variances to get a sense of how a typical sample will present itself for a given Pareto mean and Pareto variance.
In [1]:
import numpy as np
from scipy.stats import lomax
from scipy.optimize import fsolve
import pandas as pd
In [2]:
def lomax_moments_test(mean ,var):
    # Solve the system of equations for the shape and scale parameters
    def equations(params):
        shape, scale = params
        eq1 = mean - scale / (shape - 1)
        eq2 = var - shape * scale**2 / ((shape - 1)**2 * (shape - 2))
        return [eq1, eq2]

    shape, scale = fsolve(equations, (3, 3))

    return shape, scale

def lomax_moments(data):
    mean = np.mean(data)
    var = np.var(data)

    # Solve the system of equations for the shape and scale parameters
    def equations(params):
        shape, scale = params
        eq1 = mean - scale / (shape - 1)
        eq2 = var - shape * scale**2 / ((shape - 1)**2 * (shape - 2))
        return [eq1, eq2]

    shape, scale = fsolve(equations, (3, 3))

    return shape, scale
In [3]:
c= 1.3
scale = 10

scale / (c - 1) #mean =
c* scale**2 / ((c- 1)**2 * (c - 2)) #var =

sample_means = []
sample_variances = []

for _ in range(50000):
    # Generate 1000 samples from the Lomax distribution
    samples = lomax.rvs(c, scale=scale, size=50)
    sample_mean = np.mean(samples)
    sample_means.append(sample_mean )
    sample_variance = np.var(samples)
    sample_variances.append(sample_variance)

print("mean of simulated means = " + str(np.mean(sample_means)))
print("median of simulated means = " + str(np.median(sample_means)))

print("mean of simulated variances = " + str(np.mean(sample_variances)))
print("median of simulated variances = " + str(np.median(sample_variances)))
mean of simulated means = 35.32232097822492
median of simulated means = 22.199454165491623
mean of simulated variances = 20133683.651214894
median of simulated variances = 1999.904985311406
In [ ]:
We see in the final output that the median of the means is about 40% lower than the mean of the means. So 50% of samples are going to have a mean which is 40% or more lower than the mean for the underlying loss generation process. This is a big deal, and we are going to be massively underestimating our loss cost in these cases. And then the variance is even more extreme, for our c value of 1.3, we should actually have an infinite variance, the mean is coming in around 20 million, so definitely exhibiting traits of being extremely big compared to the other values, the median on the other hand is a paltry 2k, much much smaller, and we are potentially going to be tricking ourselves into using a much too small alpha value here.
Solution
So what should we do instead? We can avoid most of the problems by just using a maximum likelihood estimator instead. Even though this does nothing to change the fact that the sample mean and sample variance are likely to be unrepresentative, the method is much more forgiving in terms of producing alpha and theta parameters which are appropriate. The second thing to do, is attempt to compare the alpha parameter that we have generated with external datasets. In my opinion I would much rather see someone ignore an inappropriately low alpha value which has been generated by a dataset and just use a made up value than stick slavishly to the values generated by the data. The key point to remember is that for small sample sizes and heavy tailed distributions your data is unlikely to be representative of the properties of the full distributions in lots of subtle ways.
IFoA Exam
Here is the extract from the exam. I think the reason that its a popular exam question is that the algebra works quite nicely, and it requires you to show some understanding of what the moments of the distribution are. Plus in a written exam it would be way too fiddly to ask someone to attempt a maximum likelihood method instead. 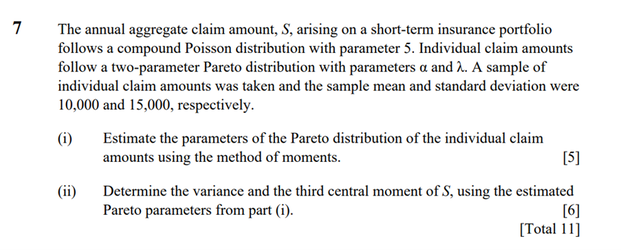
[1] https://actuaries.org.uk/qualify/prepare-for-your-exams/past-exam-papers-and-examiners-reports [2] Loss models - from data to decisions – Klugman et al. [3] Inflation and Excess insurance, Michael Fackler (2011) |
AuthorI work as an actuary and underwriter at a global reinsurer in London. Categories
All
Archives
April 2024
|
 RSS Feed
Leave a Reply.