|
Theresa May announced yesterday that the Government is considering plans to remove the triple lock on the Basic State Pension. The reason being that the triple lock is proving to be too generous to pensioners and that the money could be better spent elsewhere. www.theguardian.com/money/2017/apr/26/theresa-may-considering-scrapping-triple-lock-on-pensions I thought I would do some modelling to demonstrate the effect that the triple lock policy has on the total spending on the state pension. We will see that the triple lock is definitely unsustainable over the long term, but that the effect is relatively slow. Just to be clear, this demonstration is not an argument for or against removing the triple lock in the near future. If we believe that Pensioners are currently being being underpaid overall then we may wish to retain the triple lock for longer. If we think that Pensioners are currently being overpaid overall, then we will probably want to remove the triple lock soon. This is just a demonstration of the effect of the triple lock. What is the triple lock? The triple lock on the basic state pension states that the yearly increase in the state pension shall be the greater of:
So this means that the increase will always be at least 2.5%, but if either inflation or the increase in average earnings is greater than 2.5%, then the increase in the state pension will be more than 2.5%. A Stochastic Model of the UK Economy I set up a very basic stochastic model of the UK economy to examine the expected impact of the triple lock on the amount that the UK spends on the state pension as a proportion of the total UK budget. I first began by collecting data on the annual increases in AWE, CPI, and GDP. With this data, I then fitted correlated normal distributions to the annual increments. Once I had paramterised these variables, I then projected the spending on the state pension and also the overall UK spending by these modelled increments, year by year, over 10,000 simulations.. There are definitely more sophisticated and accurate ways of modelling the economy than this, but I think it should be good enough to give useful results. I had to make an assumption about the increase in the total UK Government spending, I decided to model this in line with GDP growth which I think should be a reasonable approximation. I have also used the fact that the UK Government currently spends 12% of the annual budget on paying the state pension as a starting point. 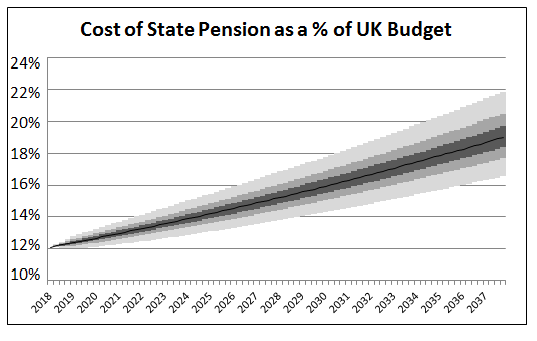 This graph shows the proportion of the UK Budget projected to be spent on the state pension over the next 20 years. I have included a colour gradient on the graph to show the uncertainty in the estimate. The different gradients show the 12.5 percentiles. The black line shows the mid point of the modelled distribution. We see that the average annual amount we expect to be spent on the state pension increases from 12% to over 20% over the course of the next 20 years. Note that this is just based on the increases from the triple lock and does not consider any changes in respect of increasing life expectancy, ageing population, or an increase in the state pension age. Therefore in practice, the effect is likely to be greater than this. An increase to 20% would be equivalent to an additional £62 billion per year in today's money on the state pension. An Alternative View From a more mathematical view, the fundamental reason the triple lock works like this can be seen from the following equation: $$\sum_{i = 2018}^{2037} {max ( a_i , b_i ) } >= max ( \sum_{i = 2018}^{2037} a_i , \sum_{i = 2018}^{2037} b_i )$$ Since we expect average annual earnings to increase in line with GDP in the long term, and we also expect the total UK budget to increase in line with GDP, we will eventually expect any series which is based on a maximum of increases to average earnings, and a fixed floor of 2.5% to reach 100% of GDP, and therefore 100% of the total UK budget. Data Sources GDP data source: data.worldbank.org/indicator/NY.GDP.MKTP.KD.ZG Average Earnings source: www.ons.gov.uk/employmentandlabourmarket/peopleinwork/earningsandworkinghours/datasets/averageweeklyearnings CPI data source: www.ons.gov.uk/economy/inflationandpriceindices/timeseries/d7g7/mm23 |
AuthorI work as an actuary and underwriter at a global reinsurer in London. Categories
All
Archives
April 2024
|
 RSS Feed
Leave a Reply.