|
I could be on my own here, but personally I always thought the definition of Sample Standard Deviation is pretty ugly. $$ \sqrt {\frac{1}{n - 1} \sum_{i=1}^{n} { ( x_i - \bar{x} )}^2 } $$ We've got a square root involved which can be problematic, and what's up with the $\frac{1}{n-1}$? Especially the fact that it's inside the square root, also why do we even need a separate definition for a sample standard deviation rather than a population standard deviation? When I looked into why we do this, it turns out that the concept of sample standard deviation is actually a bit of a mess. Before we tear it apart too much though, let's start by looking at some of the properties of standard deviation which are good. Advantages of Standard Deviation
The last property is a really important one. The $\frac{1}{n-1}$ factor is a correction we make which we are told turns the sample standard deviation into an unbiased estimator of the population standard deviation. We can test this pretty easily, I sampled 50,000 simulations from a probability distribution and then measured the squared difference between the mean of the sample standard deviation and the actual value computed analytically. 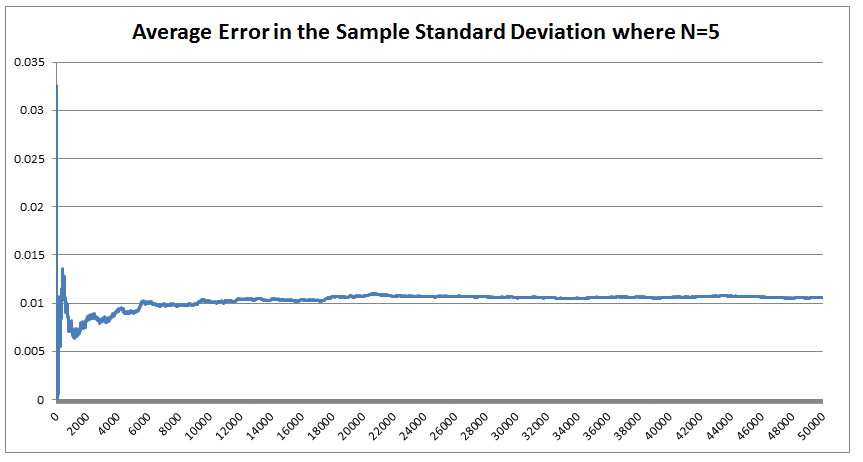 We see that the Average Error converges quite quickly but for some reason it doesn't converge to 0 as expected! It turns out that the usual formula for the sample standard deviation is not actually an unbiased estimator of the population standard deviation after all. I'm pretty sure they never mentioned that in my stats lectures at uni. The $n-1$ correction changes the formula for sample variance into an unbiased estimator, and the formula we use for the sample standard deviation is just the square root of the unbiased estimator for variance. If we do want an unbiased estimator for the sample standard deviation then we need to make an adjustment based not just on the sample size, but also the underlying distribution. Which in many cases we are not going to know at all. The wiki page has a good summary of the problem, and also has formulas for the unbiased estimator of the sample standard deviation: en.wikipedia.org/wiki/Unbiased_estimation_of_standard_deviation Just to give you a sense of the complexity, here is the factor that we need to apply to the usual definition of sample standard deviation in order to have an unbiased estimator for a normal distribution. $$ \frac {1} { \sqrt{ \frac{2}{n-1} } \frac{ \Gamma \Big( \frac{ n } {2} \Big) } {\Gamma \Big( \frac{n-1}{2} \Big)} } $$ Where $\Gamma$ is the Gamma function. Alternatives to Standard Deviation Are there any obvious alternatives to using standard deviation as our default measure of variability? Nassim Nicholas Taleb, author of Black Swan, is also not a fan of the wide spread use of the standard deviation of a distribution as a measure of its volatility. Taleb has different issues with it, mainly around the fact that it was often overused in banking by analysts who thought it completely characterised volatility. So for example, when modelling investment returns, an analyst would look at the sample standard deviation, and then assume the investment returns follow a Lognormal distribution with this standard deviation, when we should actually be modelling returns with a much fatter tailed distributions. So his issue was the fact that people believed that they were fully characterising volatility in this way, when they should have also been considering kurtosis and higher moments or considering fatter tailed distributions. Here is a link to Taleb's rant which is entertaining as always: www.edge.org/response-detail/25401 Taleb's suggestion is a different statistic called Mean Absolute Deviation the definition is. $$\frac{1}{n} \sum_{i=1}^n | x_i - \bar{x} | $$ We can see immediately why mathematicians prefer to deal with the standard deviation instead of the mean absolute deviation, working with sums of absolute values is normally much more difficult analytically than working with the square root of the sum of squares. In the ages of ubiquitous computing though, this should probably be a smaller consideration. |
AuthorI work as an actuary and underwriter at a global reinsurer in London. Categories
All
Archives
April 2024
|
 RSS Feed
Leave a Reply.