Normalized combined ratios22/3/2021 Financial Year 2020 results have now been released for the top 5 reinsurers and on the face of it, they don’t make pretty reading. The top 5 reinsurers all exceeded 100% combined ratio, i.e. lost money this year on an underwriting basis. Yet much of the commentary has been fairly upbeat. Commentators have downplayed the top line result, and have instead focused on an ‘as-if’ position, how companies performed ex-Covid. We’ve had comments like the following, (anonymised because I don’t want to look like I’m picking on particular companies): "Excluding the impact of Covid-19, [Company X] delivers a very strong operating capital generation" “In the pandemic year 2020 [Company Y] achieved a very good result, thereby again demonstrating its superb risk-carrying capacity and its broad diversification.” Obviously CEOs are going to do what CEOs naturally do - talk up their company, focus on the positives - but is there any merit in looking at an ex-Covid position, or is this a red herring and should we instead be focusing strictly on the incl-Covid results? I actually think there is a middle ground we can take which tries to balance both perspectives, and I’ll elaborate that method below. First let's collate the FY 2020 results. The table below contains the high-level figures which I’ve pulled from from individual annual reports: (disclaimer – I take no responsibility for the below table being correct, I have no particular inside knowledge of any of these financial results, and I also don’t own any of the individual stocks) 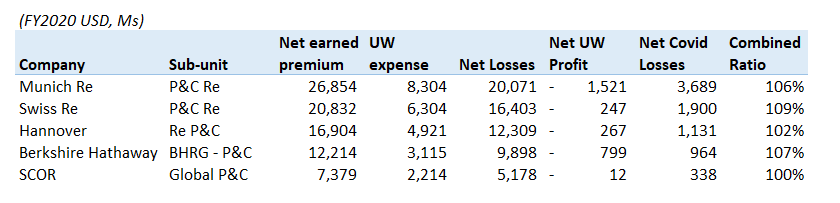 Covid normalised CR I’m going to suggest that a natural and useful way of looking at a Reinsurer’s combined ratio, is to strip out the effects of large one off events, but then add them back on as a loading, spread across multiple years. This applies not just to Covid, but to any super-cat event (let’s say anything excess 50bn to market). To see how this would work, let add another column to our table representing the ex-covid combined ratio, and also a column with the amount that covid added to the combined ratio.  So interestingly, Munich Re had the best CR ex Covid, but were also the worst effected by Covid. SCOR on the other hand were not as heavily hit by Covid, but then had an ex-Covid CR which was not as strong. The step we are going to take now is to add back on the effect of Covid, but on an amortised basis. The idea being that a Covid style event will not happen every year, but pandemics have happened periodically through human history, and will undoubtedly happen again. What’s our estimate of how frequently they will occur? Well, we’ve had two serious pandemics in the last 100 years – Covid and Spanish Flu, so let’s just go with 1 in 50. It’s an interesting thought experiment trying to pick this number, and you can easily make arguments that it should be higher or lower than this pick, but we’ll use 1 in 50 for the time being. What does this do to our table? Let’s create a normalised CR, which is equal to the ex. Covid CR but with a 1-in-50 loading of the ‘Covid effect’. 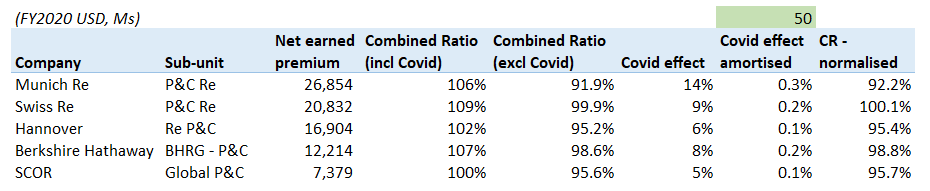 So we see that putting Covid in as a 1-in-50 really doesn’t add much to a normalised CR. If you’re going to take a 10% hit from Covid once every 50 years, that’s actually fairly manageable. Is this the end of the story then, case closed? Not quite… If we are going to amortise Covid down to its proper return period, we should really add back other major events which did not occur this year as a normalised loading. For example, HIM in 2017 hit the major Reinsurers for something like a 15%-30% additional loss ratio. If we call HIM - or a US WS of a similar magnitude - a 1 in 10 (another pick that could be debated further), then this would add between 1.5% and 3% to our normalised CR. Another loading we should consider is the effect of a potential 400bn super-cat (from cyber/ US Windstorm/any other source), let’s call this a 1-in-100, and assume that it would be 4 times more costly than HIM (which we’ll say was a 100bn to the market). Then this would add between 60%-120% to loss ratios approx. once every 100 years, i.e. 0.6%-1.2% annualised. Here is how our normalised CR looks adding in these two style events on top of our covid effect. 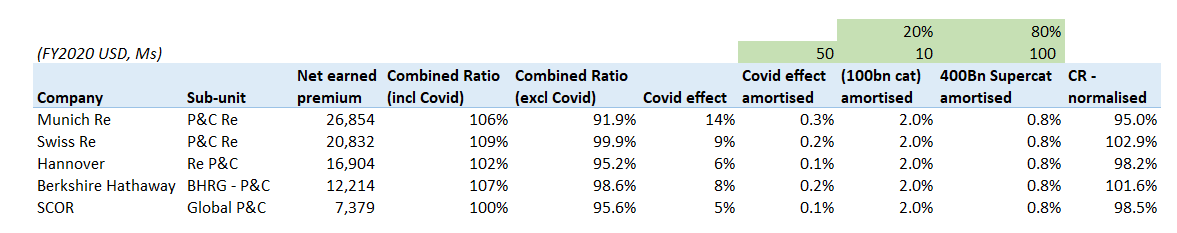 Now we are seeing normalised CRs which for everyone except Munich are probably above long term targets. Obviously, this is just a sketch of a method, there are a large number of tweaks that would need to be make in practice. For example, each Reinsurer is going to react differently to a 100bn cat event, whereas we’ve just used a flat 2% for all reinsurers. One method would be to derive loss ratio ‘additions’ based on individual company losses from past events. So for example, try to infer information about Hannover’s US WS exposure by how they were effected by HIM, and use this as information when picking a prospective pick for Hannover. Reinsurers are also going to react differently depending on where geographically the loss occurs – US WS vs JP WS, etc? And moreover, none of these losses are operating within a static system either – if a HIM style loss occurred again tomorrow I’m sure the losses for each reinsurer would look different to their 2017 results depending on the action they took post-loss to tweak their underwriting focus and controls.
What’s your surplus? The final concept I want to touch on is that since these are financial year results, we should be careful in how we treat the ex-cat CR. Each reinsurer is going to be sitting on a different surplus (or deficit) in their reserves, and they will each be in a different stage of addressing or releasing this. Let’s say one of the reinsurers has a lower ex-cat CR than another, here are four scenarios which are all plausible on the face of it.
And what if the correct answer is some combination of the above? Conclusion The thought I’d like to conclude on is that when analysing these results, the important point to remember is that super-cat events will occur. In the years they occur, reinsurers will put up bad results and this is not necessarily the end of the world. However if we strip out the effect of these style of events, then we need to remember that this ex-supercat CR also needs to contain enough margin but pay for the amortised cost of the supercats, and then leave us some profit. |
AuthorI work as an actuary and underwriter at a global reinsurer in London. Categories
All
Archives
April 2024
|
 RSS Feed
I dont understand why normalizing a bad results is necessary. It is what it is. Reinsurance exist so that it is able to support during bad times.
Hi Joshua,
Thanks for you comment.
The reason for normalising the result is to assess whether the company has long term profitability when the bad years are taken into account. i.e. if you run to 96% most years, but then 150% 1 year in 10, then you could argue you don't actually have a profitable business, because you're expected profitability is 101% (0.9*96% + 0.1*150%)
That's the kind of reasoning I'm trying to get across here.
These results are the financial year results for the company as a whole, so will already be net of any relevant reinsurance or retro.
Thanks,
Lewis
Leave a Reply.