Cefor Exposure Curves3/3/2022 I hadn't see this before, but Cefor (the Nordic association of Marine Insurers), publishes Exposure Curves for Ocean Hull risks. Pretty useful if you are looking to price Marine RI. I've included a quick comparison to some London Market curves below and the source links below. 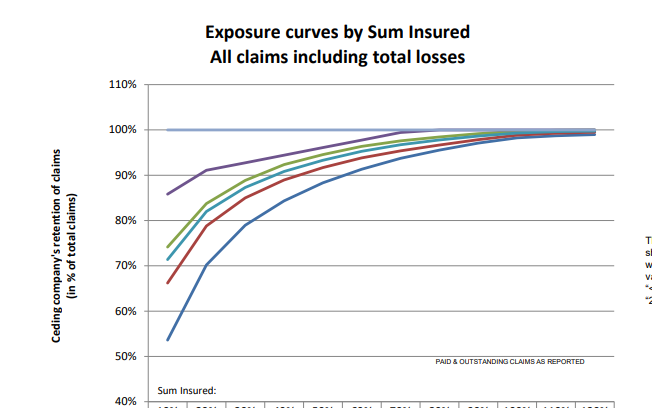 London Market Marine Hull Comparison I quickly compared them to some 'London Market' Marine Hull curves I've seen before, and generally the Cefor curves seemed more bottom heavy i.e. allocate more premium share to the lower retentions. This makes intuitive sense, the Cefor report informs us that the curves were parameterised against loss data covering 2015-2020, whereas the London Market curves (assuming they even were derived from actual loss data), would have been parameterised in the distant past (but at the very least 20+ years ago). If the London Market curves allocate more premium higher up, i.e. are more 'Total Loss', this is consistent with a higher rate of total loss in the past, and the general trend of a decrease in total loss rate for vessels over the last 20 years or so. Source links: See the bottom of the following page for the source link, at the full report: cefor.no/statistics/nomis/2020/nomis---as-of-december-2020/ I think it's great that Cefor are putting out this kind of information, other than some old Swiss Re curves, publicly available exposure curves are few and far between, but they are very useful for the recipients and it also raises the profile of Cefor. |
AuthorI work as an actuary and underwriter at a global reinsurer in London. Categories
All
Archives
April 2024
|
 RSS Feed
Leave a Reply.