An Actuary learns Machine Learning – Part 4 – Error correction/data cleansing/Feature Engineering10/1/2021 
In which we do more data exploration, find and then fix a mistake in our previous model, spend some time on feature engineering, and manage to set a new high-score. Source: https://somewan.design
Before starting anything new, let’s summarise what we’ve done so far. We’re trying to learn machine learning, and as a first project we’re having a go at the Titanic competition on Kaggle. We started by building a model in Excel, which just used pivot tables and which actually performed okay. We then followed a tutorial and got a Random Forest algorithm working. Encouragingly this algorithm out-performed the pivot table model. We then dipped our toe into the topics of feature importance, k-fold cross validation, and hyper-parameter tuning.
But what should we really have done? According to online sources, the ideal data analysis workflow should run something like this:
As you may have spotted we basically skipped stages 1 and 2. In the earlier posts, I just wanted to get something up and running, but now that we’ve got the time I think it would be worth revisiting the earlier stages. So our first job for today is to go back and re-do stages 1 and 2 properly. As usual I’ve set up a standalone Github page with all the code from today’s post: github.com/Lewis-Walsh/ActuaryLearnsMachineLearning-Part4 Exploratory data analysis Let’s start by just calling the head method on our training data: Input: TrainHead = train_data.head() Output: 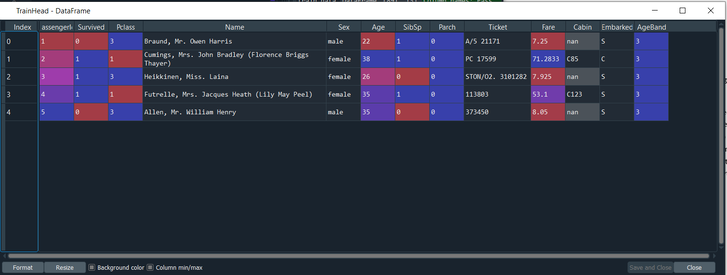
It seems the head method only actually shows 5 rows, we’d like a few more – let’s bump it up to 20:
Input: TrainHead = train_data.head(n=20) Output: 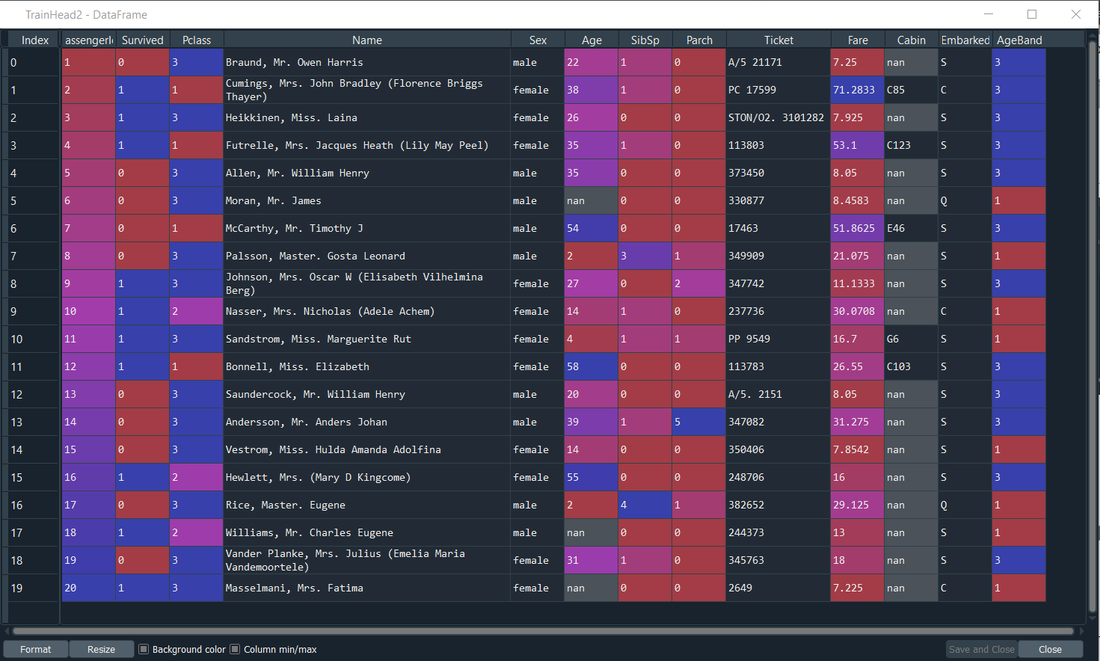
Is there anything we can see in the data why might be interesting or useful? There’s two things I can see straight away – firstly the Age column has some missing numbers and this seems to have caused some errors. For example, the 19th row - Mrs. Fatima Masselmani – has a blank value for her age, however her ‘age band’ has been set to 1 – the lowest age group! It seems our age band must be interpreting her age as 0, rather than blank and allocating her to the ‘children’ group. She is clearly a ‘Mrs’, so this is very unlikely to be the case, yikes!
We’re going to have to fix this, my bad! Instead of rehashing all the old posts and showing you the code I’m re-running, we’re going to fast-forward [Insert Rocky style cut scene, but replace Stallone's the raw egg drink with black coffee] And bingo all our models are re-run, and I’ve pasted our updated results table below, and our pivot table model has taken the lead again! If I hadn’t been the one to make the mistake in the first place, I’d be quite pleased with myself at this point. Of course our purpose here is to learn machine learning, but I was secretly hoping the Excel model would outperform the ‘out the box’ machine learning model. 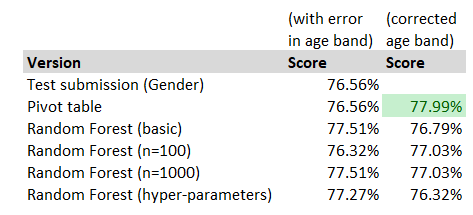
Before we get ahead of ourselves and declare this a victory for the actuaries and Excel, it’s probably worth pointing out that the actual number of different correct predictions is pretty small between our best and worst model. We’re probably in the realm of spurious accuracy when comparing our models here. The fact that our pivot model out-performs may just be a function of the fairly limited test dataset – there’s only 6 correct predictions in it between our pivot model and the basic gender submission.
Cleaning data Now that we corrected that error, we can get back to analysing the data. We run the ‘info’ command to give us details of the training dataset: Input: train_data.info() Output: 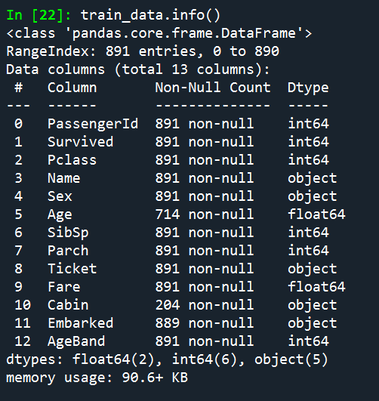
So all looks good so far. Name, Sex, Ticket, Cabin, and embarked are all being treated as strings. The rest are all numerical, which is fine. And we can see that Age has fewer values completed than the other columns – which is what we saw above when using the head command.
Let’s look at some descriptive statistics for these columns: Input: descTrainData = train_data.describe() Output: 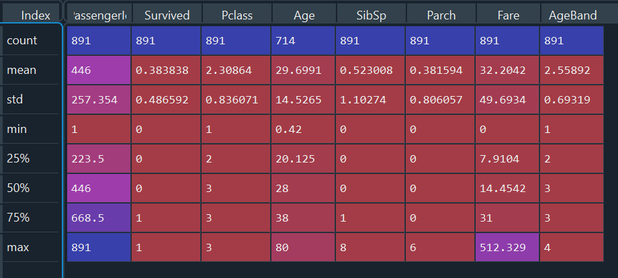
We can see again the Age columns has some missing entries as the count is lower than the other columns. Other than that, nothing else too interesting to highlight.
Okay, so other than fixing the Age issue, there’s not actually anything we’ve picked up data-wise at this stage. Feature engineering The next step is to do a bit more feature engineering – what we’re going to do is extract the ‘title’ from passenger names. Luckily the format of the name column is fairly uniform – the title is nicely nestled between a comma and a full stop, we can use this to extract the title using some fairly straightforward string manipulation. I won’t bore you with the details of this. Here is the head command with this extra column on the right. We can see most titles Mr, Mrs, Master, etc. coming through. 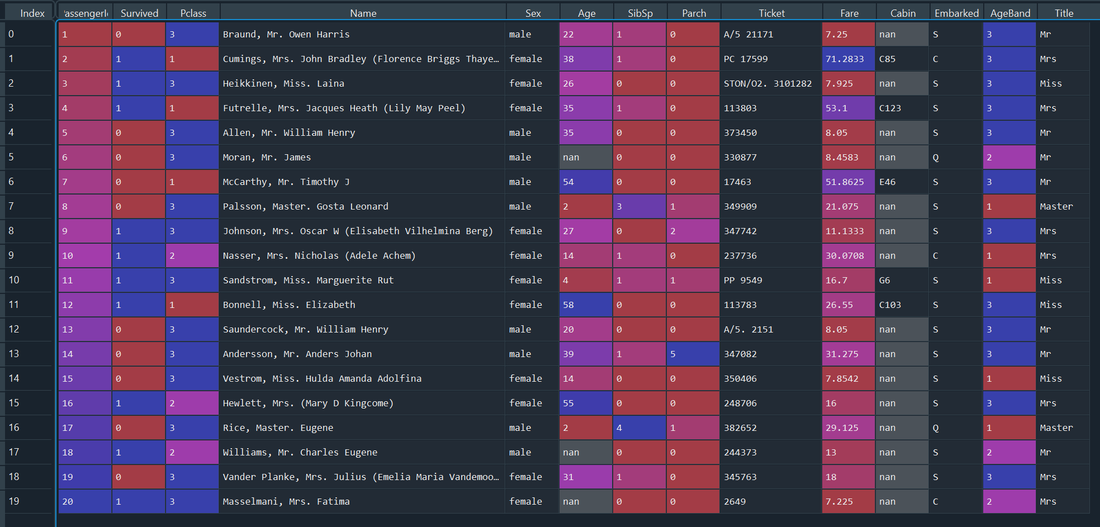
Let’s quickly run a command to see all the titles that are in this column:
Input: UniqueTitles = train_data.Title.unique() Output: 
So we’ve got all the titles you’d expect, plus a few weird ones in here – I had to look up Jonkheer (roughly equivalent to ‘squire’ in the UK apparently) – let’s get a count of each title using the pivot function:
Let’s add to this the number of survivors and get a survival probability. Input: UniqueTitlePivot = train_data.pivot_table(index='Title',values='PassengerId',aggfunc=len) UniqueTitlePivot2 = train_data[['Title', 'Survived']].groupby(['Title'], as_index=True).mean() UniqueTitlePivot3 = pd.merge(UniqueTitlePivot , UniqueTitlePivot2, left_index=True,right_index=True)
Output:
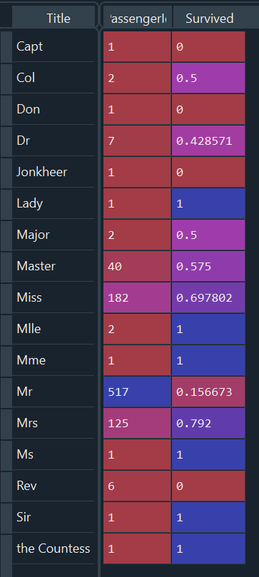
Let’s talk about this table breifly – clearly ‘Mr’ is a terrible title to have in terms of survival (as expected because we already knew men performed badly). Another interesting one is ‘Rev’ – 0 for 6 survived, which is quite admirable! I guess the clergy were willing to put other people first on the boats ahead of themselves. I’m surprised the more military titles (Capt, Col, Major etc.) actually had a reasonable survival chance – I thought they would also go in for self-sacrifice - apparently not. Of these titles the survival rate was 2 out of 5, higher than the ‘Mr’ category.
Once again, we’re going to re-run all our code with this extra feature in our data-set. [Insert another montage scene, possibly based on Rocky 2 this time] And here is our updated table: 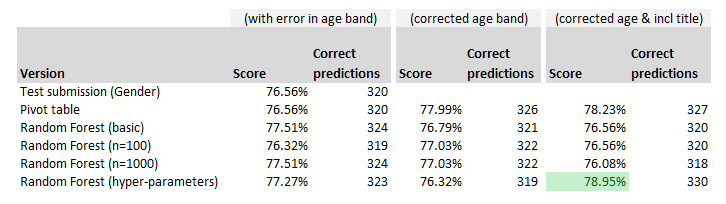
And our Random Forest algorithm has shot forward to take the lead! In particular the version which uses k-fold CV to select the best hyper-parameters.
That’s all for today’s post, I think we had quite a successful session there. We corrected an issue which giving us an improvement in performance, and also briefly propelled the Excel model to the top of the leader board. We then carried out some more feature engineering by bringing in the title of the passenger, which further improved the performance of all our models, but improved our Random Forest algorithm with k-fold CV to set hyper-parameters in particular, which set a new high-score on our league table of models. Tune in next time for our final look at the Titanic competition, where we will try a handful of other machine learning algorithms, and hopefully improve our score further, and learn some more along the way. |
AuthorI work as an actuary and underwriter at a global reinsurer in London. Categories
All
Archives
April 2024
|
 RSS Feed
Leave a Reply.