
In which we don’t actually improve our model but we do improve our workflow - being able to check our test score ourselves, analysing the importance of each variable using an algorithm, and then using an algorithm to select the best hyper-parameters
Source: https://somewan.design
As usual you can find a standalone version of all the Python code on my Github page:
https://github.com/Lewis-Walsh/ActuaryLearnsMachineLearning-Part3 In the previous post we had to upload our submission to Kaggle in order to check our score. Since we are not using Kaggle’s own platform (which is called something like ‘Kaggle notebook’) but are running the code locally in Spyder, this means each time we want to get a score for a model, we need to output our submission to a csv and then upload the csv through Chrome. Trust me, this get a little bit tedious after a while. Also Kaggle only allows a max of 10 uploads per day, a limit I haven’t hit yet, but could potentially be limiting. Task one for today is to come up with some way of automating this checking. We’ve basically got two ways of making this easier; one is to find a way of uploading our script to the Kaggle website directly from Python, the second is to download the ‘correct’ answers from somewhere online and then do the checking ourselves. But how are we going to get the correct answers? One thing I noticed looking at the leaderboard for the Titanic competition is that there are thousands of people with a perfect score of 100%. Something feels a little fishy here, I suspect not all of these entries are 100% honest… in order to get 100% you’d have to predict every single survival/death from the Titanic accurately. Yet there was a fair amount of random luck in who survived. What I suspect people have done is download the correct answers from somewhere and then just upload that as a submission. Wouldn’t it be useful if we could get hold of one of these ‘cheat’ submissions and then repurpose it to automate our checking? Here is a screenshot of the leaderboard with all the perfect scores: 
After a bit of googling I was able to find someone who had put the answers online (someone even made the process of cheating easy for anyone who is so inclined). I chucked this into Excel along with my submissions, and then set up a few simple formulas to output the test score: 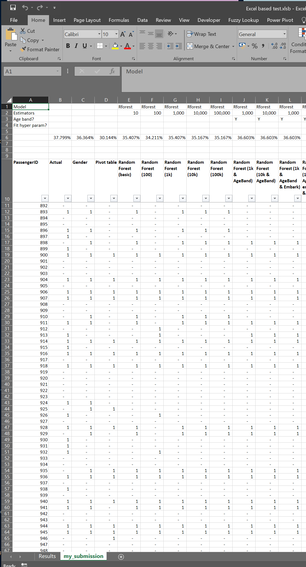
Now this is set up, all we need to do to check an entry is output to a csv and paste it into this Spreadsheet. I can probably guess your natural reaction to this – why the hell go to all this trouble to automate the checking but then still keep a step in where you need to paste into Excel? Why not take it one step further and run the comparison in Python? Well - I like being able to see the results – I don’t know if this is as a result of hard won experience due to it being less error prone, or if I’m just being old fashioned.
Feature importance Second task for today, is to find some way of understanding which variables are the most important, without having to do large amounts of of manual work. We built up some pretty good intuition when we set up the model in Excel using pivot tables, but as it currently stands the RandomForest model is a complete black box. The method we want is something called ‘feature importance’. Once we have fit our model we can call it by just using the code below, which also creates a bar chart of which features are the most important. It took me an embarrassingly long time to actually get the bar chart part working, but that’s partly what this is about – practicing doing things in Python. Input: #%% Get Feature importance Feature_import = RFmodel.feature_importances_ FIdf = pd.DataFrame(Feature_import,ColList) ax = FIdf.plot.bar() Output: 
Which produces the following graph. We can see that PClass and Sex standout as our most important features. 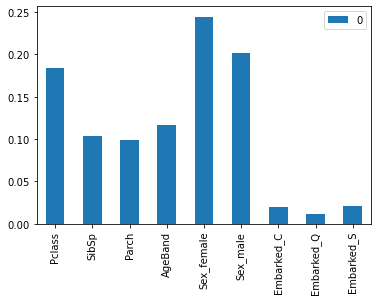
There is a lot more we can do on feature importance, but for the time being I think we can leave it there. This is something we will revisit another day.
Hyper-parameters Final task for today is to fit the model using an automated hyper-parameter tuning algorithm called K-fold cross validation. You can read about this idea here: https://machinelearningmastery.com/k-fold-cross-validation/ I’ve got to say I really like this concept – it’s fairly simple to understand and implement, and it performs a very useful function. This is the kind of thing that actuaries could learn from data scientists. The idea is that we split the dataset into k random groups of equal size (k is an integer which can vary, but here we will use k=10). We then iterate over these k groups, selecting one group at random to be our test set, and fitting the model to the other k-1 groups. Using the model we’ve fitted against the k-1 groups, we then test the goodness of fit against the remaining test set. At which point we repeat the process lots of time, and average across all our scores. A robust model should be able to perform well against all the possible k-groups within the training set. We can then take this an extra step and use this algorithm to optimise across our space of possible hyper-parameters, and determine the hyper-parameters which provide the best performance in the k-fold CV test. Which should hopefully be hyper-parameters which perform the best against our test set. That’s enough waffling for now, let’s get to some actual code. My approach is based on the following, which also has a good description of how CV-folding works. https://towardsdatascience.com/hyperparameter-tuning-the-random-forest-in-python-using-scikit-learn-28d2aa77dd74 First we need to set up an array of the hyper-parameter space we wish to search: Input:
#%%Set up space of possible hyper-params

# Number of trees in random forest
n_estimators = [int(x) for x in np.linspace(start = 200, stop = 2000, num = 10)]
# Number of features to consider at every split
max_features = ['auto', 'sqrt']
# Maximum number of levels in tree
max_depth = [int(x) for x in np.linspace(10, 110, num = 11)]
max_depth.append(None)
# Minimum number of samples required to split a node
min_samples_split = [2, 5, 10]
# Minimum number of samples required at each leaf node
min_samples_leaf = [1, 2, 4]
# Method of selecting samples for training each tree
bootstrap = [True, False]
# Create the random grid
random_grid = {'n_estimators': n_estimators,
               'max_features': max_features,
               'max_depth': max_depth,
               'min_samples_split': min_samples_split,
               'min_samples_leaf': min_samples_leaf,
               'bootstrap': bootstrap}
print(random_grid)
Output: 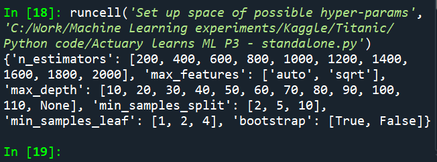
We then fit our model using slightly different code to our standard Random Forest algorithm. This version takes a minute or so to run on my laptop, guess this is a hint that some good stuff is happening.
Input: RFmodel = RandomForestClassifier(random_state=1) # Random search of parameters, using 3 fold cross validation, # search across 100 different combinations, and use all available cores RFmodel_random = RandomizedSearchCV(estimator = RFmodel, param_distributions = random_grid, n_iter = 100, cv = 3, verbose=2, random_state=1, n_jobs = -1) # Fit the random search model RFmodel_random.fit(X, Y) predictions = RFmodel_random.predict(X_test) RFmodel_random.best_params_ Output: 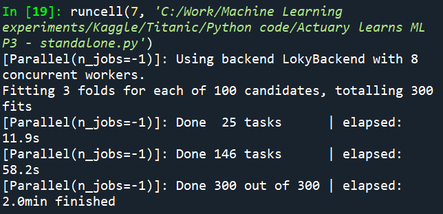
And once we’ve done all this, what is the end result?
Our model, once again, has not actually improved! Here is our table, with the latest model inserted at the bottom. The basic default Random Forest is still the best model, go figure. 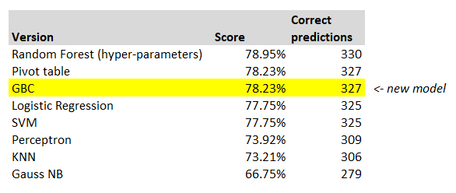
I’m going to consider today a partial success. Ultimately we’re trying to learn some new skills, so the fact it hasn’t actually helped here is not a problem per se. And what have we learned this time? We’ve now got a way of looking at feature importance, we’ve been introduced to k-fold cross validation, and we’ve used k-fold cross validation to fit a model. That seems like a decent amount of progress, let’s hope these new skills pay off in the long run.
Next time we are going to return to the basics and spend a bit of time on cleaning our data, possibly extracting extra features, and also introducing a way of examining correlations between variables. |
AuthorI work as an actuary and underwriter at a global reinsurer in London. Categories
All
Archives
April 2024
|
 RSS Feed
Great read tthankyou
Leave a Reply.