
In which we build our first machine learning model in Python, beat our previous Excel model on our first attempt, and then fail multiple time to improve this new model…
Source: https://somewan.design
Now that we’ve had a go at solving the problem without help (which to be honest was not the unmitigated success I secretly hoped it would be) it’s time to listen to the experts. The plan is to follow a tutorial, get set up in Python, and get our first proper machine learning algorithm working. Once accomplished we will be free to update our CV, sprinkling in the terms 'Sklearn', 'Data Scientist', 'Deep Neural Netorks', and then either immediately ask for a pay rise, or just cut out the middle man and apply for that job at Google, haven't figured out that final step yet.
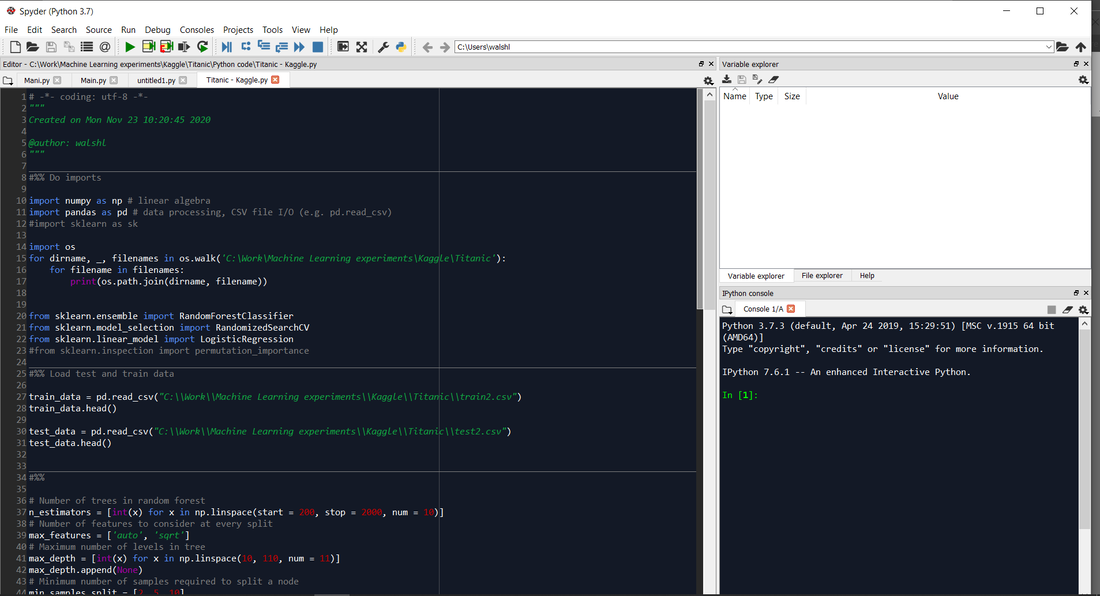
This tutorial I'm going to be following is the one linked below, it uses a random forest algorithm, implemented in Python, on the Titanic dataset. If you are interested in doing the tutorial yourself then I'd recommend following the link rather than using my notes below. If on the other hand you're mainly here to watch me stumble though and potentially make an idiot of myself, then stick around, I'm sure there will be plenty below to interest you. Link to the actually well written tutorial mentioned above: https://www.kaggle.com/alexisbcook/titanic-tutorial I've put all the code from this post in the following Github repository: github.com/Lewis-Walsh/ActuaryLearnsMachineLearning-Part2 In all the snippets below I’m using Python as my scripting language, and Spyder as my IDE. To those unfamiliar with Spyder it looks like the following:
The bottom right has the Python console, which can be used to input single commands and displays any text outputs. The main window on the left is where we write our code, and the top right is currently displaying our variables – none at the moment. I’m using Spyder rather than the basic Python IDE, this type of data analysis is basically what Spyder is designed for, and the whole process is much smoother and more fun.
The code The first step is to import the libraries we are going to need, namely pandas to import and process the data, numpy to carry out any of the linear algebra style data manipulation, and sklearn to build the actual model. Input: #%% Do imports import numpy as np # linear algebra import pandas as pd # data processing, CSV file I/O (e.g. pd.read_csv) from sklearn.ensemble import RandomForestClassifier from sklearn.model_selection import RandomizedSearchCV Output:
Import data
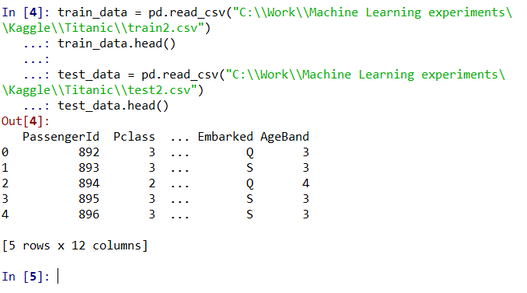
Next up we’re going to import our data, and quickly check it’s in the format we expect, using the head method. Input:
#%% Load test and train data
train_data = pd.read_csv("C:\\Work\\Machine Learning experiments\\Kaggle\\Titanic\\train2.csv")
train_data.head()
test_data = pd.read_csv("C:\\Work\\Machine Learning experiments\\Kaggle\\Titanic\\test2.csv")
test_data.head()
Output:
Build features from data
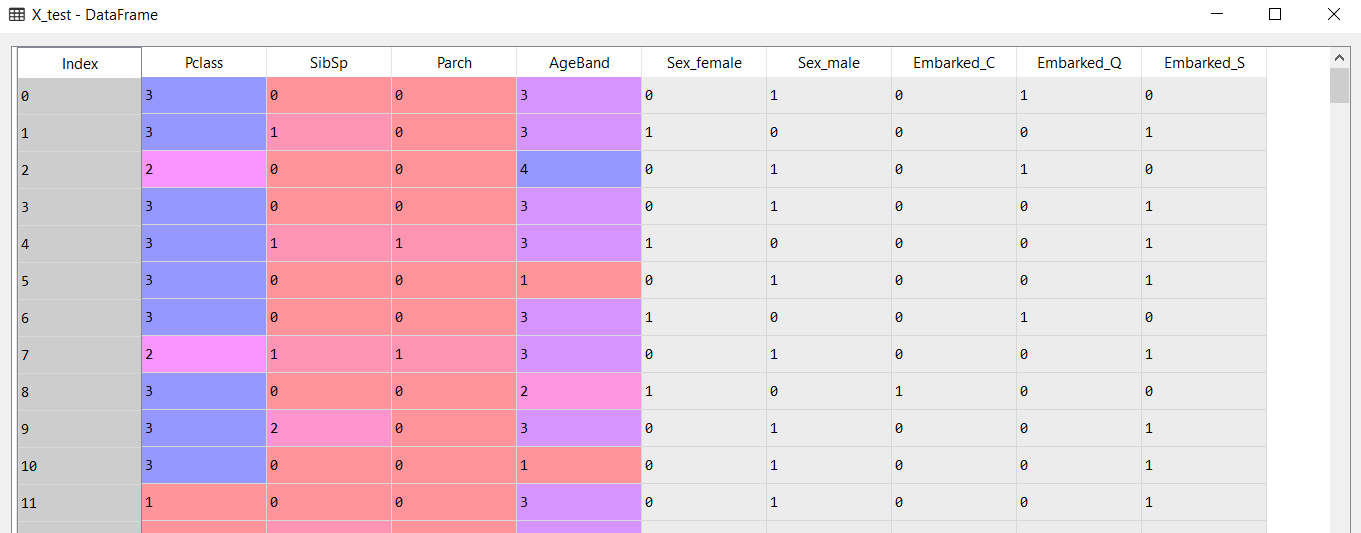
Next we use a built in pandas function called get_dummies to convert our features into 0s and 1s in order to get it into the format required for the random forest algorithm: Input: #%% Set-up model Y = train_data["Survived"] features = ["Pclass","Sex","SibSp","Parch","Embarked","AgeBand"] X = pd.get_dummies(train_data[features]) X_test = pd.get_dummies(test_data[features]) Output:
Opening up the variable explorer to see what this has done and what our X_test looks like:
Running the model
Now we come to the most important part, fitting and running the model. Which turns out to be surprisingly very easy! Input: #%% Run model RFmodel = RandomForestClassifier(random_state=1) RFmodel.fit(X,Y) predictions = RFmodel.predict(X_test) Output: 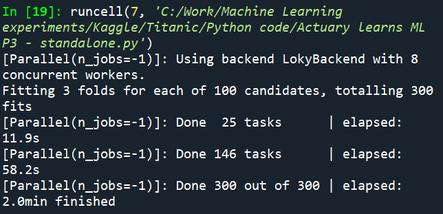
All that is left now is to output our predictions:
Input:
#%% Output

output = pd.DataFrame({'PassengerID': test_data.PassengerId, 'Survived': predictions})
output.to_csv('my_submission1kAgeEmbarkedWithHyperCV - LogReg.csv',index=False)
Output:
And that’s it! We can now upload our submission and see what test score we get. And drum roll….. our score is … 77.52%
To put that into context, let’s create a table of our scores so far:
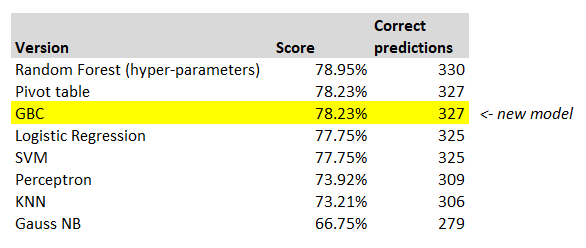
So on our very first go at building a machine learning model, just using the default parameters, we’ve managed to beat both the test submission, and also our model built in Excel using a pivot table. Without intending to sound melodramatic, I hope this model is not a metaphor for the entire actuarial profession!
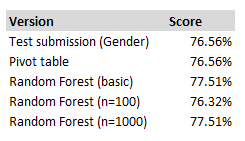
Improving our score Since it was so easy to build the model, let’s play around and try to improve our score. According to online sources, here is how we should go about doing so (in order of importance): 1) Add more data – e.g. additional data sources 2) Clean up the data – investigate missing values, any errors, etc. 3) Feature engineering – interpret our data in creative ways to build new features (e.g. link up surnames in the titanic dataset to add a ‘family’ feature to our model) 4) Adjusting hyper-parameters 5) (and if all that fails to get the desired result, try a different algorithm) Because I’m lazy, I’m going to jump straight to number four. In order to add more data, clean it, or do feature engineering we are going to have to do quite a lot of data manipulation, whereas adjusting hyper-parameters just involves changing a few numbers in our python code and re-running. Adjusting Hyper-parameters The hyper-parameter we are going to play around with is n_estimators, which determines how many trees are in our forest. Increasing this number makes the model slower to run, so surely more is better right? The default parameter is n=10 which is what we used above as we did not change it, let’s try n=100, and n=1000. Here is the code for n=100: Input: RFmodel = RandomForestClassifier(n_estimators=100,random_state=1) RFmodel.fit(X,Y) predictions = RFmodel.predict(X_test) The code for running n=1,000 is almost the same we just change the n_estimators value, so I won’t repeat it. When we upload these new tests to Kaggle we get the following results:
Interestingly with n=100 we actually get a worse performance, and with n=1000 we get back to the performance of our first model. Turns out there is a reason tuning hyper-parameters is almost bottom of the list of things to try!
That’s it for this instalment, I think we made some good progress. We got our first machine learning model set up – which was surprisingly easy. We out-performed both the test submission and the pivot table model, and we then had a first attempt at tweaking our model. From an 'actuarial' perspective, there is a negative to this new model - as it currently stands it's a complete blackbox - we've got no real insight over who has been selected as surviving, and why. It's possible we might be able to draw out this insight, but unlike our pivot model, it's certainly not something that arises naturally as we're building the model. Next time we are going to look into doing two things – firstly automating our test submission upload process and secondly using an algorithm to help us select the optimal hyper-parameters, in a process I’m thinking of calling machine learning-ception. Hopefully both of these changes will allow us to iterate our model much more efficiently. |
AuthorI work as an actuary and underwriter at a global reinsurer in London. Categories
All
Archives
April 2024
|


 RSS Feed
Leave a Reply.