An Actuary learns Machine Learning - Part 13 - Kaggle Tabular Playground Competition - June 221/7/2022 
In which we recreate the previous analysis, but in Python this time. And then add a new submission using Mean rather than median to impute missing values. Source: https://somewan.design
Here's the extract from the Jupyter workbook, it's fairly self-explanatory so I won't really spend time working thought what's happening.
In [7]:
!pip install pandas
!pip install sklearn
Requirement already satisfied: pandas in c:\users\admin\anaconda3\envs\notebook\lib\site-packages (1.4.3)
Requirement already satisfied: numpy>=1.18.5 in c:\users\admin\anaconda3\envs\notebook\lib\site-packages (from pandas) (1.23.0)
Requirement already satisfied: python-dateutil>=2.8.1 in c:\users\admin\anaconda3\envs\notebook\lib\site-packages (from pandas) (2.8.2)
Requirement already satisfied: pytz>=2020.1 in c:\users\admin\anaconda3\envs\notebook\lib\site-packages (from pandas) (2022.1)
Requirement already satisfied: six>=1.5 in c:\users\admin\anaconda3\envs\notebook\lib\site-packages (from python-dateutil>=2.8.1->pandas) (1.16.0)
Requirement already satisfied: sklearn in c:\users\admin\anaconda3\envs\notebook\lib\site-packages (0.0)
Requirement already satisfied: scikit-learn in c:\users\admin\anaconda3\envs\notebook\lib\site-packages (from sklearn) (1.1.1)
Requirement already satisfied: joblib>=1.0.0 in c:\users\admin\anaconda3\envs\notebook\lib\site-packages (from scikit-learn->sklearn) (1.1.0)
Requirement already satisfied: threadpoolctl>=2.0.0 in c:\users\admin\anaconda3\envs\notebook\lib\site-packages (from scikit-learn->sklearn) (3.1.0)
Requirement already satisfied: numpy>=1.17.3 in c:\users\admin\anaconda3\envs\notebook\lib\site-packages (from scikit-learn->sklearn) (1.23.0)
Requirement already satisfied: scipy>=1.3.2 in c:\users\admin\anaconda3\envs\notebook\lib\site-packages (from scikit-learn->sklearn) (1.8.1)
In [8]:
import pandas as pd
import numpy as np
from sklearn import impute
In [9]:
#%% Run imports

mypath=r"C:\Users\Admin\OneDrive - BerkRe UK\Documents\Work\Machine Learning experiments\Kaggle - June - Missing Values\Data\data.csv"
TrainData = pd.read_csv(mypath)

mypath=r"C:\Users\Admin\OneDrive - BerkRe UK\Documents\Work\Machine Learning experiments\Kaggle - June - Missing Values\Data\Missing Values.csv"
MissingValues = pd.read_csv(mypath)

mypath=r"C:\Users\Admin\OneDrive - BerkRe UK\Documents\Work\Machine Learning experiments\Kaggle - June - Missing Values\Data\sample_submission.csv"
SampleSub = pd.read_csv(mypath)
In [10]:
imputer = impute.SimpleImputer(strategy='median')

imputer.fit(TrainData)
Xtrans = imputer.transform(TrainData)

TrainColumns = TrainData.columns.tolist()
In [11]:
# Then need to extract relevant 'missing' values

sub = []

for i in range(1000000):
    Row = MissingValues['Row'][i] #.apply(int)
    Column = MissingValues['Column'][i] #.apply(int)
    indexC = TrainColumns.index(Column)
    sub.append(Xtrans[Row][indexC])

SampleSub['value'] = pd.DataFrame (sub, columns = ['value'])
In [12]:
SampleSub.to_csv(r"C:\Users\Admin\OneDrive - BerkRe UK\Documents\Work\Machine Learning experiments\Kaggle - June - Missing Values\Submissions\Sub 3 - recreate median in Python v2.csv",index=False)
Note that we haven't really done any actual data analysis yet, we've just been getting the basic framework set up, but that's okay. Just so that we can say we made some actual progress today, let's quickly run a version where we impute the missing values using mean rather than median and see what result that gives. I only need to change a single line in the code above to do this, so I won't paste it again below, let's just look straight at the results: 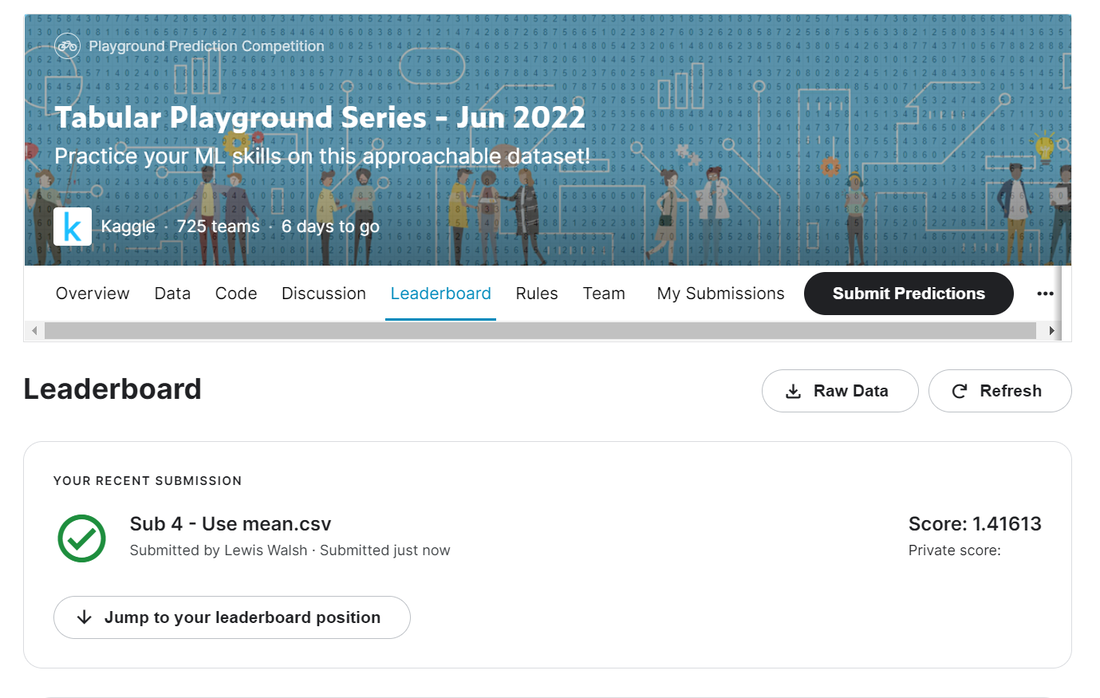
We've got a very marginal improvement vs our previous best of 1.417 -> 1.416 Note, I'm not really sure it's best practice to use the leaderboard like this to compare my successive attempts, I should probably set up my own test/train split so as to avoid over-fitting to the public leaderboard. Maybe something to do next time? So tune in next time where we'll do some EDA, and also think about what sort of model makes sense to impose on the data so as to give ourselves some structure to work with. |
AuthorI work as an actuary and underwriter at a global reinsurer in London. Categories
All
Archives
April 2024
|
 RSS Feed
Leave a Reply.