 In which we enter a machine learning competition, predict who survived the titanic, build an Excel model, and then realise it performs no better than Kaggle’s ‘test submission’... Source: https://somewan.design I’ve written up these notes with the hope that readers find my faltering first steps into the world of machine learning interesting and informative. The sketch of how I’m planning on 'learning' machine learning is simple - work through a series of Kaggle competitions (a website with machine learning challenges), following tutorials initially, looking up issues as I go, and above all learning by doing. Once I’ve got a good grounding in the practice of machine learning, I might work backwards and fill in the technical bits by reading textbooks and watching tutorials after that, but above all we're going to try to build things. With the boring stuff explained, let's dive into our first problem: Step 1 – the problem From Kaggle (www.kaggle.com/c/titanic) The sinking of the Titanic is one of the most infamous shipwrecks in history. On April 15, 1912, during her maiden voyage, the widely considered “unsinkable” RMS Titanic sank after colliding with an iceberg. Unfortunately, there weren’t enough lifeboats for everyone onboard, resulting in the death of 1502 out of 2224 passengers and crew. While there was some element of luck involved in surviving, it seems some groups of people were more likely to survive than others. In this challenge, we ask you to build a predictive model that answers the question: “what sorts of people were more likely to survive?” using passenger data (ie name, age, gender, socio-economic class, etc). Step 2 – the data So we're going to try to build a model to predict whether individuals survive the sinking of the titanic. Let’s just dive-in and see how far we get on our own without looking up anything, for me that means building a model in excel. You can download my excel model and follow along yourself through the following Github repository: github.com/Lewis-Walsh/ActuaryLearnsMachineLearning-Part1 The first step is to download our data from Kaggle, and have a look at what the training dataset looks like: 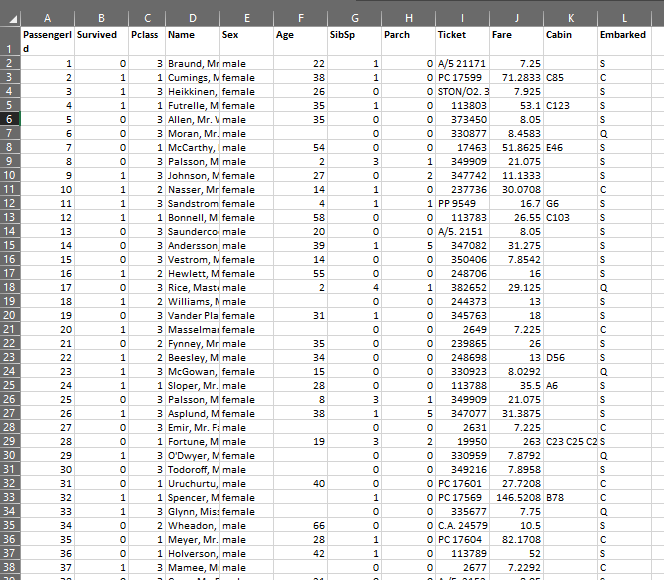 We’ve got quite a few columns of useful info – Pclass tells us the class of the passenger, Age is probably going to be important. SibSp tells us if a passenger had either siblings or a spouse on-board with them, pArch gives us info on parents. So how does an actuary build a model from this mess? I present one of the single most important tools in finance – the pivot table. Let’s pivot on a few variables and see what we come up with: First, how many passengers have we got and what was the overall survival rate? 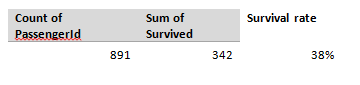 So we’ve got 891 passengers with 342 surviving, a 38% survival rate – this is our base survival level, and frankly if you were on the titanic, your odds aren’t great. Let’s look at a few variables in turn and see how they impact this survival rate, first male vs female: 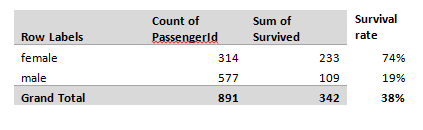 Wow, okay – 74% of females survived, and just 19% of men – now that’s an important factor! It also ties up with our intuition. The age old adage goes ‘women and children first’, and this is clearly born out in the data. Next up – I suspect passenger class is also going to be important, let’s look at that pivot. 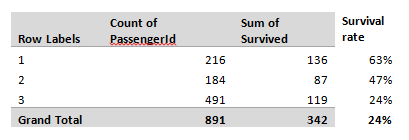 Once again, some quite clear divisions, though this time less strong than our male vs female split. An average 1st class passenger was only slightly more likely to survive than not, though 3rd class passengers clearly do not have good odds. Our third variable we are going to try is age. In order to do something sensible with a pivot table, we are going to have to group our ages into a few bands – I decided to use four bands – children (0-15 yrs), older teens (15-19), Adults (20-60), Older passengers (61-100). Before anyone objects to me calling a 60 year old ‘old’ we are talking about over 100 years ago, life expectancy was quite a bit lower then. Age turns out to not be a very strong factor: 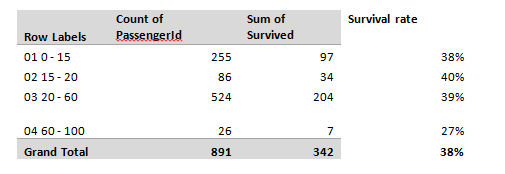 The only group with a strong effect is over 60s who had a much lower chance of surviving than other groups. Interestingly children do not seem to have a higher chance of surviving than average - not what I was expecting. Since we are just trying to build a simple ‘baseline’ model here, let's skip investigating more variables. Multi-way tables Okay, so we’ve got a sense of a few of the variables. Let’s see what happens when we combine them. First up, let’s combine sex and class: 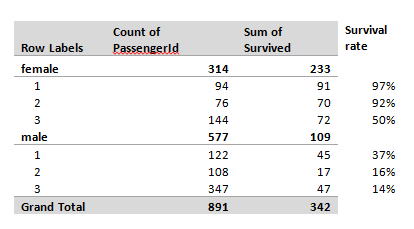 So what is interesting here is that sex seems to dominate class – being a 1st class male makes you more likely to survive than a 3rd class male, but frankly your odds are still not great, and they are much worse than even a 3rd class female. Another interesting point is that 1st and 2nd class females have great survival rates they are pretty unlucky if they don’t make it off alive – 3rd class females are more borderline. I wonder what happens when we chuck in age as well – will we start to be able to split this bucket with a bit more nuance? Here is our final table, combining all 3 factors we've analysed so far: 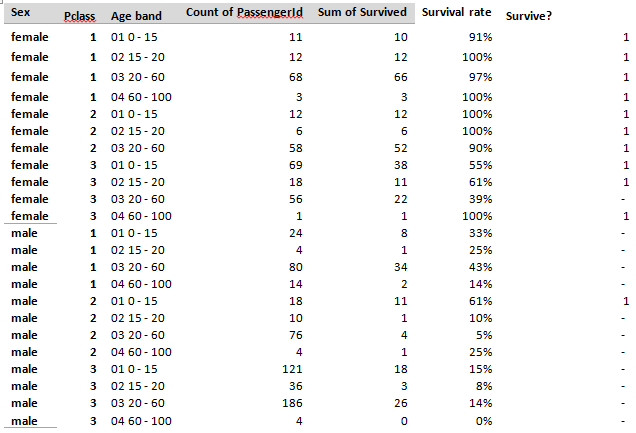 For our test set, we are going to estimate survival for the cohort if the survival ratio in the table above is >50%, and estimate death if the rate is <50%. So females for example, are predicted to survive if they are 1st or 2nd class, but not if they are 3rd class.
For males, the model is predicting death for all groups except for 2nd class children. This seems strange – wouldn’t we expect 1st class males to survive with a higher rate? This probably warrants further investigation, but rather than digging in deeper now. Let’s just leave in this quirk, and see how the model performs. Okay, so we’ve got our first predictive model – it’s not much, literally just a pivot table with three variables, and the observations are not particularly interesting. Let’s upload our entry and see how it performs: When we upload the test, we get a result of 76.550% - which seems like an okay first attempt – we correctly predicted the survival/death of 76.55% of the test set. Also included in the data downloaded from Kaggle is another data set which is intended to be used as a test submission – this model just uses the following simple rule – males died, females survived. I uploaded this as I thought it could serve as a useful baseline. It was to my chagrin that I discovered, upon uploading this test that our score was – you guessed it 76.55%... So it’s here we pause and take stock. We haven’t actually done any machine learning yet, but we’ve played around with the data in excel and come to understand the problem a little better. We built a model and it works, but frankly it appears our pivot table model is really not that good – no better than the test upload provided by Kaggle which uses a much simpler rule set. Tune in next time where we build our first machine learning model, play around with some hyper-parameters, and finally outperform the basic Kaggle model. |
AuthorI work as an actuary and underwriter at a global reinsurer in London. Categories
All
Archives
April 2024
|
 RSS Feed
Leave a Reply.